
Figures & data
Figure 1. Sinusoidal AC 8 mT Magnetic field 50 Hz (MF), (length 33.5 cm and diameter 15 cm).
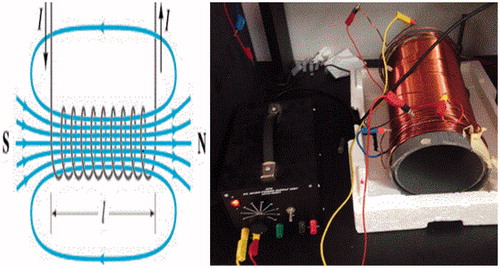
Figure 2. (ESEM) image of nanocurcumin after coating with Pt using a 15 kV: Magnification 60000×; Working distance 9.2 mm; Scale bar 1 μm.
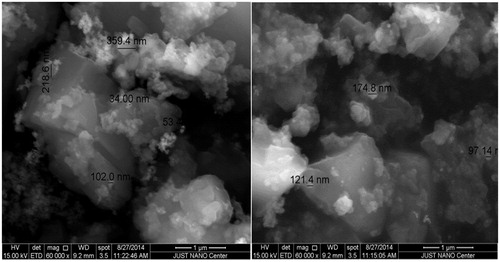
Table 1. IC50 values for NANOCUR-MF and CUR-MF.
Figure 3. (A) Viability of PC3 cancer cells for NANOCUR-MF at different nanocurcumin concentrations versus control sample. (B) Viability of PC3 cancer cells for CUR-MF at different curcumin concentrations versus control sample. The Y-axis indicates the cell viability at λ = 550 nm, and the X-axis corresponding to curcumin concentration. Data represent three independent experiments.
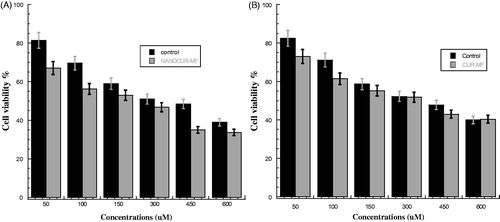
Figure 4. (A) Viability of HEK cancer cells for NANOCUR-MF at different nanocurcumin concentrations versus control sample. (B) Viability of HEK cancer cells for CUR-MF at different curcumin concentrations versus control sample. The Y-axis indicates the cell viability at λ = 550 nm, and the X-axis corresponding to curcumin concentration. Data represent three independent experiments.
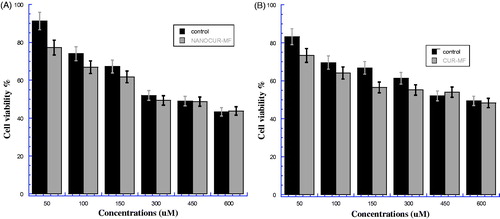
Figure 5. (A) Hemolysis percentage for nanocurcumin with combined 8 mT magnetic field (NANOCUR-MF). Different concentrations of solutions (50, 100, 200, 400, and 600 μM) were incubated with 4% human erythrocytes suspension, Results were recorded at λ = 570 nm after exposed 60 min where p < 0.05 (p = 0.02). (B) Hemolysis percentage for curcumin with combined 8 mT magnetic field (CUR-MF). Different concentrations of solutions (50, 100, 200, 400 and 600 μM) were incubated with 4% human erythrocytes suspension. Results were recorded at λ = 570 nm after exposed 60 min where p < 0.05 (p = 0.024).
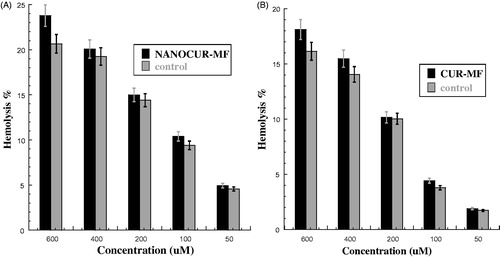
Table 2. Hemolytic effect of NANOCUR-MF versus control with efficiency percentage on human erythrocytes after 60 min of incubation.
Table 3. Hemolytic effect of CUR-MF versus control with efficiency percentage on human erythrocytes after 60 min of incubation.
Figure 6. The bacteria growth after treatment by nanocurcumin combined with 8 mT magnetic field (NANOCUR-MF) at different concentrations then incubated overnight at 37 °C: (A) Escherichia coli, (B) Micrococcus luteus, (C) Pseudomonas aeruginosa, and (D) Staphyloccus aureus. The Y-axis represents the inhibition, and the X-axis corresponds to nanocurcumin concentrations. The results were repeated in triplicates. The standard deviation was in the range (0–1.64) for NANOCUR-MF samples, while was in the range (0.005–1.55) for control.
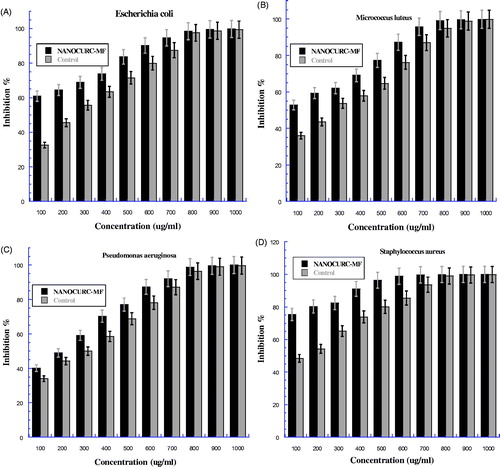
Table 4. Minimum bactericidal concentration (MBCs) of NANOCUR-MF comparing with control against the test microorganisms.
Figure 7. The bacteria growth after treatment by curcumin combined with 8 mT magnetic field (CUR-MF) at different concentrations then incubated overnight at 37 °C: (A) present Escherichia coli, (B) Micrococcus luteus, (C) Pseudomonas aeruginosa, and (D) Staphyloccus aureus. The Y-axis represents the inhibition and the X-axis corresponds to curcumin concentrations. The results were repeated in triplicates. The standard deviation was in the range (0–1.91) for CUR-MF samples, while was in the range (0.138–1.56) for control.
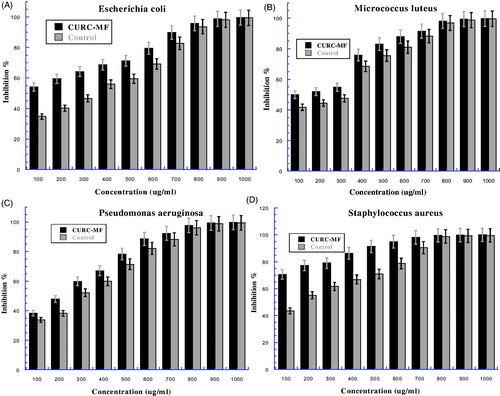
Table 5. Minimum bactericidal concentration (MBCs) of CUR-MF comparing with control against the test microorganisms.