
Figures & data
Figure 1. Schematic illustration of SAWE electrospinning method.
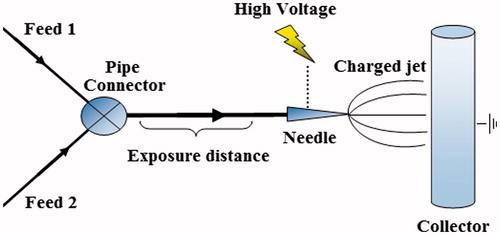
Table 1. Electrospinning process parameters.
Figure 2. Effect of voltage on SAWE and RB fiber morphologies at constant tip to collector distance (10 cm) and flow rate (1.4 mL/h): (a) 9, (b) 12 and (c) 15 kV.
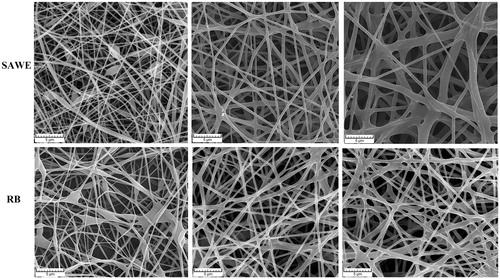
Figure 3. Effect of voltage on SAWE and RB average fiber diameter.
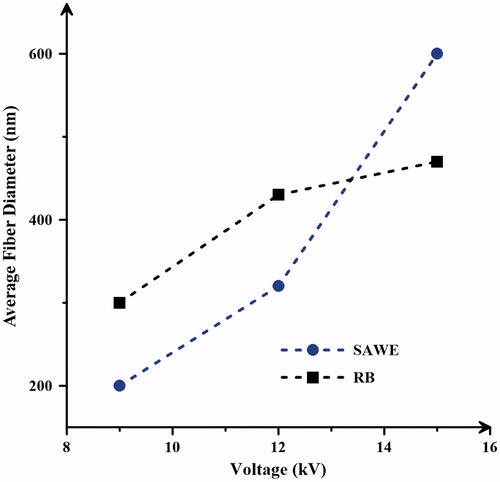
Figure 4. SEM images and corresponding FDDs of SAWE and RB (a) before and (b) after water immersion for 72 h.
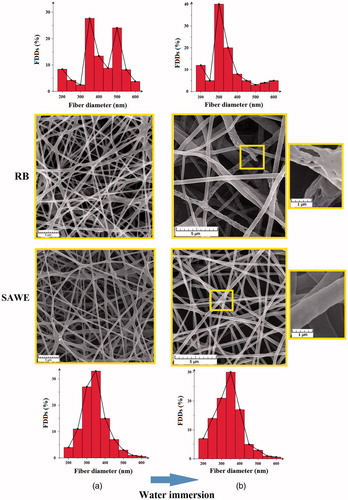
Figure 5. TEM images of (a) SAWE and (b) RB fibers.
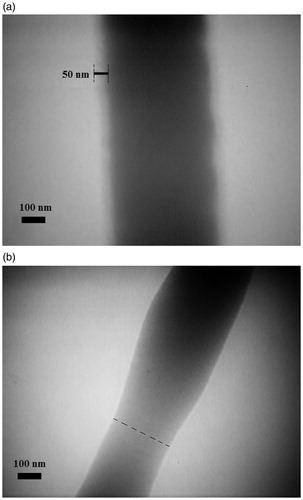
Figure 6. ATR-FTIR spectra of pristine P123 and neat PCL, RB and SAWE scaffolds.
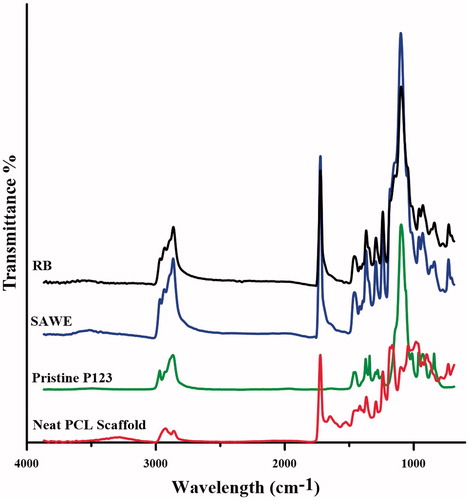
Figure 7. The swelling ratio of electrospun neat PCL, SAWE and RB scaffolds.
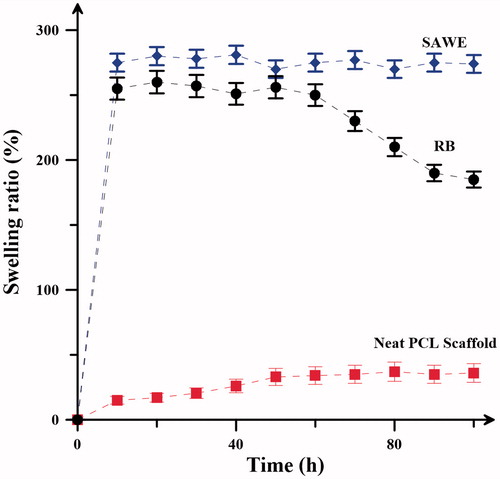
Figure 8. Schematics of (a) SAWE and (b) RB fiber behavior before and after water immersion.
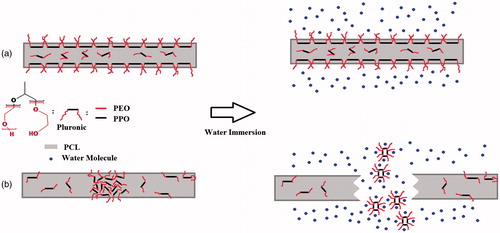
Figure 9. Fractional cumulative release of DPH from SAWED and RBD together with Peppas, Weibull and Modified Korsmeyer–Peppas models fits.
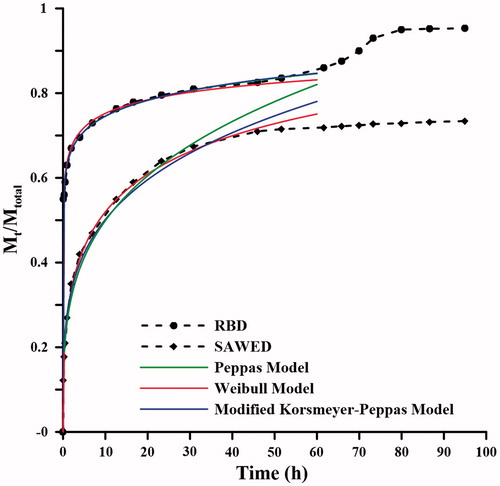
Table 2. Parameters of fitted models on drug release profiles.