Figures & data
Figure 1. Scanning electron microscopy of siRNA and drug-loaded TMC nanoparticles.
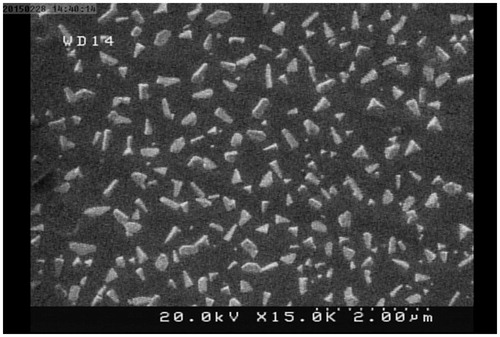
Table 1. Size, charge, and PDI of NPs.
Figure 2. FTIR spectra of TMC NPs, a: TMC, b: Dox, c: Dox-TMC.
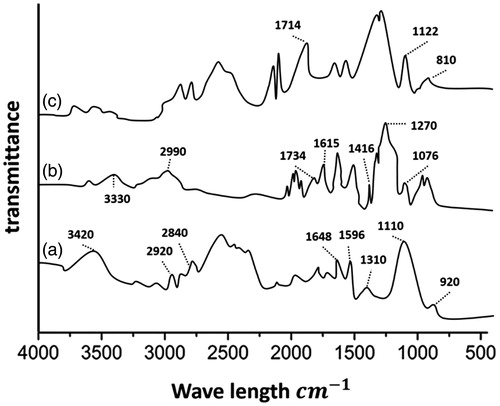
Figure 3. (a) Serum stability of siRNA–TMC NPs incubated in serum over a period of time (1: naked siRNA, 2:1 h, 3:3 h, 4:6 h, 5:9 h, 6:12 h, 7:24 h, 8:48 h, 9:72 hr, 10:96 h). (b) Heparin stability of siRNA–TMC NPs in various volumes of heparin (1: naked siRNA, 2: without heparin, 3:0.6 μL, 4:1.5 μL, 5:3 μL).
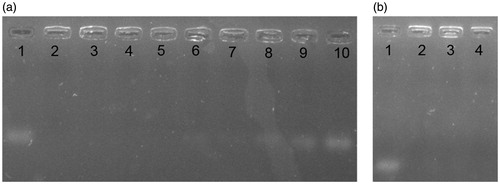
Figure 4. In vitro release profile of drug doxorubicin (A) and siRNA HMGA2 (B) from trimethyl chitosan nanoparticles in pH 7.4 and 5.5 at 37 °C.

Figure 5. Cytotoxicity of MDA-MB-231 cells after 24 h of incubation with four concentrations of medicinal categories.
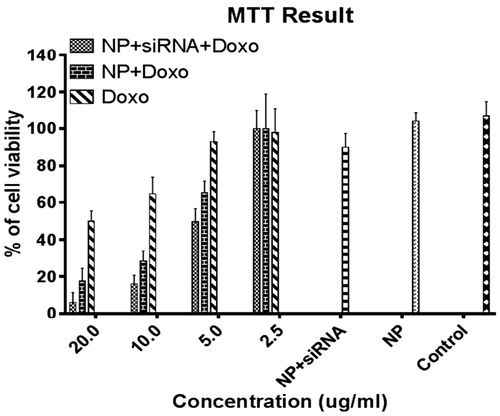
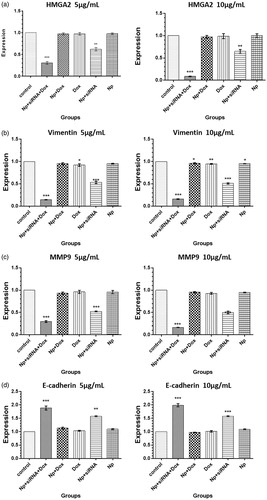
Figure 6. (a) HMGA2, (b) Vimentin, (c) MMP9, (d) E-cadherin expression in MDA-MB-231 cells following treatment with different medicinal categories.