Figures & data
Figure 1. Life-sustaining ability of various resuscitation fluids in a rat hemorrhagic shock model. Rats hemorrhaged 65% of their total blood volume, and then each group (n = 8) received different resuscitation fluids: 1.5 g/kg pPolyHb, 0.6% hetastarch (HES), whole blood (WB), or normal saline (NS), plus twice the lost blood volume of NS. Survival was determined at 1 d intervals starting from the end of infusion of resuscitation fluids.
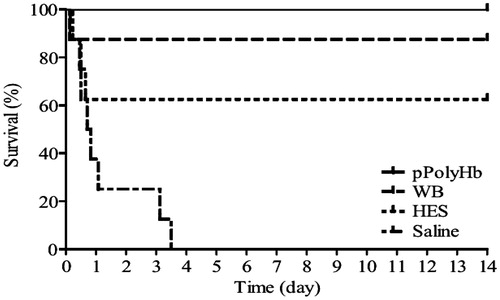
Table 1. Demographic data and survival times in different groups.
Figure 2. Blood pressure and heart rate in rat hemorrhagic shock model. (A) Mean arterial blood pressure (MAP) and (B) heart rate (HR) were monitored every 10 min throughout the experiment. R: resuscitation. *p < 0.05 in comparison with baseline; #p < 0.05 in comparison with the pPolyHb group; $p < 0.05 in comparison with the WB group.
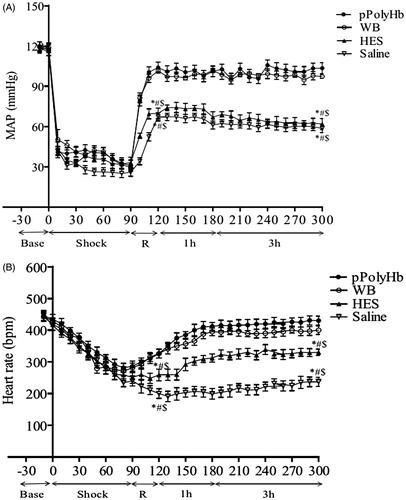
Table 2. Baseline blood gas parameters in different groups.
Figure 3. Lactate, base excess (BE), HCO3−, and pH values in hemorrhagic shock model rats. Blood samples were drawn before the start of hemorrhage (baseline), end of shock and end of resuscitation to assess anaerobic metabolism. Blood gas analysis was performed on an ABL 800 (Radiometer, Copenhagen, Denmark). *p < 0.05 in comparison with baseline; #p < 0.05 in comparison with the pPolyHb group; $p < 0.05 in comparison with the WB group. (A) Lactate levels at different periods in rats resuscitated with pPolyHb, WB, HES, or saline. (B) BE levels at different periods in rats resuscitated with pPolyHb, WB, HES, or saline. (C) HCO3 levels at different periods in rats resuscitated with pPolyHb, WB, HES, or saline. (D) pH values at different periods in rats resuscitated with pPolyHb, WB, HES, or saline.
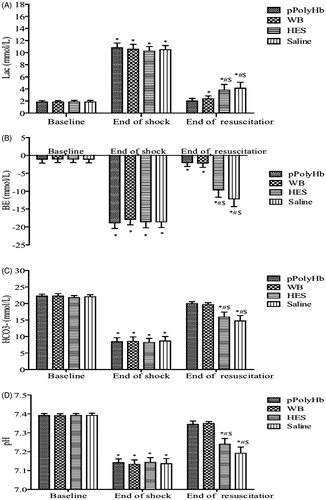
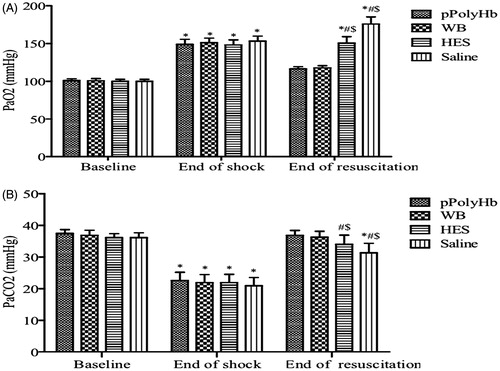
Figure 4. PaO2 and PaCO2 levels in hemorrhagic shock model rats. Blood samples were drawn before the start of hemorrhage (baseline), end of shock, and end of resuscitation to test PaO2 and PaCO2 levels. Blood gas analysis was performed on an ABL 800 (Radiometer, Copenhagen, Denmark). *p < 0.05 in comparison with baseline; #p < 0.05 in comparison with the pPolyHb group; $p < 0.05 in comparison with the WB group. (A) PaO2 levels at different periods in rats resuscitated with pPolyHb, WB, HES, or saline. (B) PaCO2 levels at different periods in rats resuscitated with pPolyHb, WB, HES, or saline.