Figures & data
Figure 1. Effects of Poly-[Hb-SOD-CAT-CA] (pe) on ethanol-induced AST release in rat primary hepatocytes. Rat primary hepatocytes were pre-incubated with 5 μL, 10 μL, or 15 μL of Poly-[Hb-SOD-CAT-CA] (pe) or PolyHb (p) for 2 h before treated with 200 mmol/L alcohol (a) for 12 h. *P < 0.05 versus 200 mm alcohol group.
![Figure 1. Effects of Poly-[Hb-SOD-CAT-CA] (pe) on ethanol-induced AST release in rat primary hepatocytes. Rat primary hepatocytes were pre-incubated with 5 μL, 10 μL, or 15 μL of Poly-[Hb-SOD-CAT-CA] (pe) or PolyHb (p) for 2 h before treated with 200 mmol/L alcohol (a) for 12 h. *P < 0.05 versus 200 mm alcohol group.](/cms/asset/5d129b2d-3ad4-498c-9ba5-23ebe22ae4bd/ianb_a_1191229_f0001_c.jpg)
Figure 2. Poly-[Hb-SOD-CAT-CA] down-regulates ethanol-induced MDA in rat primary hepatocytes. Rat primary hepatocytes were pre-incubated with Poly-[Hb-SOD-CAT-CA] (pe) PolySFHb (p) for 2 h before exposure to 200 mmol/L alcohol (a) for 12 h. *P < 0.05 versus 200 mm alcohol group.
![Figure 2. Poly-[Hb-SOD-CAT-CA] down-regulates ethanol-induced MDA in rat primary hepatocytes. Rat primary hepatocytes were pre-incubated with Poly-[Hb-SOD-CAT-CA] (pe) PolySFHb (p) for 2 h before exposure to 200 mmol/L alcohol (a) for 12 h. *P < 0.05 versus 200 mm alcohol group.](/cms/asset/50bf411a-1c73-46f7-9447-d40f62c8d7e9/ianb_a_1191229_f0002_c.jpg)
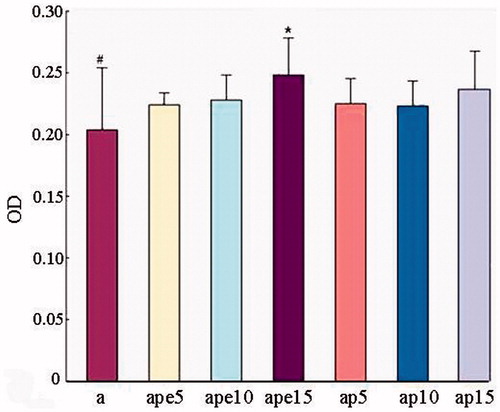
Figure 3. Effects of Poly-[Hb-SOD-CAT-CA] on ROS generation in rat primary hepatocytes injured by alcohol (a). Rat primary hepatocytes were pre-incubated with 5 μL, 10 μL, or 15 μL of Poly-[Hb-SOD-CAT-CA] (pe) and PolyHb (p) for 2 h before treated with 200 mmol/L alcohol (a) for 12 h. *P < 0.05 versus 200 mm alcohol group.
![Figure 3. Effects of Poly-[Hb-SOD-CAT-CA] on ROS generation in rat primary hepatocytes injured by alcohol (a). Rat primary hepatocytes were pre-incubated with 5 μL, 10 μL, or 15 μL of Poly-[Hb-SOD-CAT-CA] (pe) and PolyHb (p) for 2 h before treated with 200 mmol/L alcohol (a) for 12 h. *P < 0.05 versus 200 mm alcohol group.](/cms/asset/4c5eb3d6-7a6f-4fdf-b953-6e930404726b/ianb_a_1191229_f0003_c.jpg)
Figure 4. ROS production was determined by CellRox Green and Hoechst 33342 staining in rat primary hepatocytes. Rat primary hepatocytes were pre-incubated with Poly-[Hb-SOD-CAT-CA] or PolySFHb for 2 h before treated with 200 mmol/L alcohol for 12 h. B: control, C: 200 mm alcohol, D: 5 μL PolyHb-SOD-CAT-CA +200 mm alcohol, E: 10 μL PolyHb-SOD-CAT-CA +200 mm alcohol, F: 15 μL PolyHb-SOD-CAT-CA +200 mm alcohol, G: 5 μL PolyHb +200 mm alcohol, H: 10 μL PolyHb +200 mm alcohol, I: 15 μL PolyHb +200 mm alcohol (arrow points an example of overlap of staining).
![Figure 4. ROS production was determined by CellRox Green and Hoechst 33342 staining in rat primary hepatocytes. Rat primary hepatocytes were pre-incubated with Poly-[Hb-SOD-CAT-CA] or PolySFHb for 2 h before treated with 200 mmol/L alcohol for 12 h. B: control, C: 200 mm alcohol, D: 5 μL PolyHb-SOD-CAT-CA +200 mm alcohol, E: 10 μL PolyHb-SOD-CAT-CA +200 mm alcohol, F: 15 μL PolyHb-SOD-CAT-CA +200 mm alcohol, G: 5 μL PolyHb +200 mm alcohol, H: 10 μL PolyHb +200 mm alcohol, I: 15 μL PolyHb +200 mm alcohol (arrow points an example of overlap of staining).](/cms/asset/c120bd39-9bec-413e-9c3e-a28019eb3b77/ianb_a_1191229_f0004_c.jpg)
Figure 5. Effects of PolyHb-SOD-CAT-CA on the viability of rat primary hepatocytes. Rat primary hepatocytes were pre-incubated with 5 mL, 10 mL, or 15 mL of PolyHb-SOD-CAT-CA (pe) and PolyHb (p) for 2 h before treated with 200 mmol/L alcohol (a) for 12 h. *P < 0.05 versus 200 mm alcohol group.