Figures & data
Figure 1. The analysis process of this study.
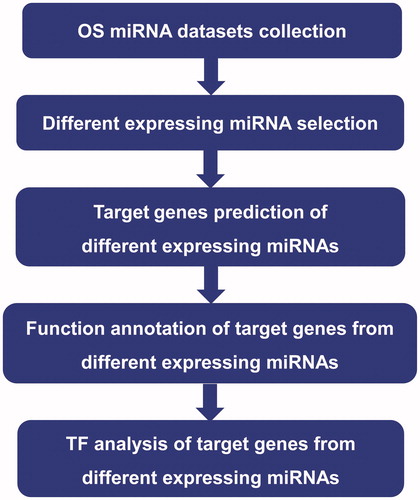
Table 1. Information of all seven data sets.
Figure 2. Distribution of DEMs alterations in OS as reported by primary studies. Short vertical bars indicate down- or up-regulated miRNA. There were significant differences in both up-regulated and down-regulated miRNAs between different data sets.
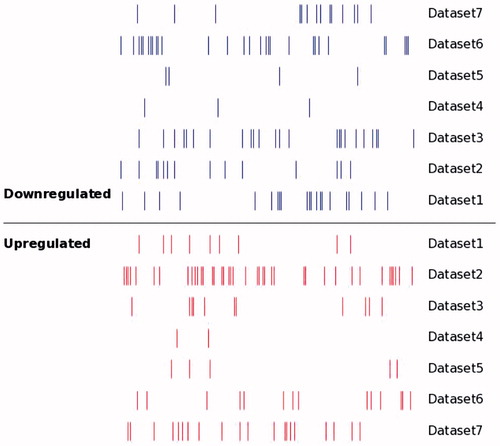
Figure 3. Statistics of the number of up- and down-regulated miRNA in the existing seven independent miRNA expression data set in osteosarcoma the left pillars in each dataset represents the quantity of up-regulated miRNA compared with the normal sample tissue expression; the right pillars in each dataset represents the quantity of down-regulated miRNA.
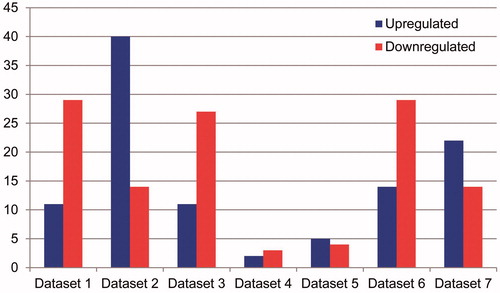
Figure 4. Number of up- and down-regulated miRNA correspond to the seven independent data set.
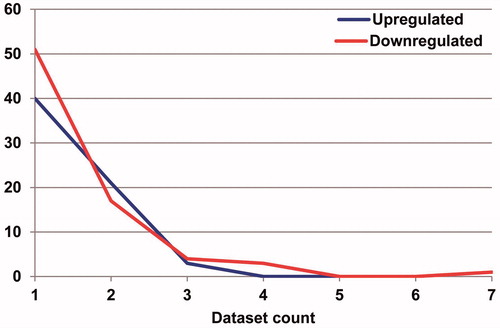
Table 2. List of miRNA with meta characteristics in osteosarcoma.
Figure 5. Metabolic pathways enrichment of target genes of miRNA Target genes of Seven out of 12 DEMs possessed appropriate Pathway enrichment. The gradient from green to red represents the corresponding Pathway proportion (%) of the terms in the miRNA target genes, and the deeper the color, the higher the proportion.
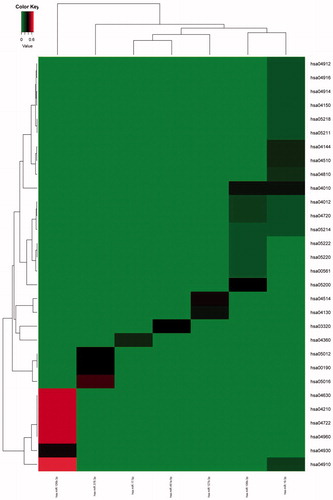
Table 3. GO annotation of target genes of up-regulated miRNA in osteosarcoma.
Table 4. GO annotation of target genes of down-regulated miRNA in osteosarcoma.
Figure 6. Metabolic pathways enrichment analysis of target genes of up-regulated miRNA in osteosarcoma Target genes of up-regulated miRNA were mainly enriched in four pathways, with cancer possessing the highest enrichment degree.
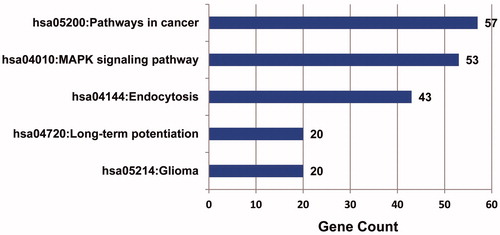
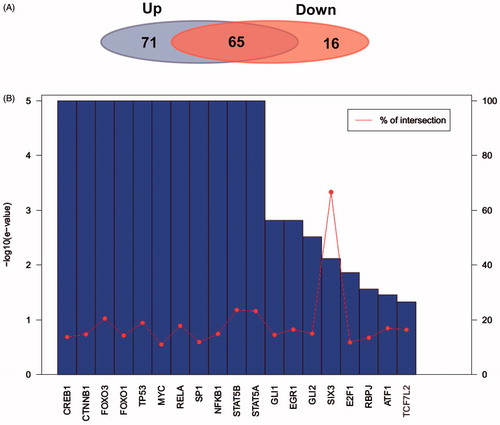
Figure 7. Transcription factor analysis of target genes of up- and down-regulated miRNAs. (A) Share and specific transcription factor comparison of target genes of up- and down-regulated miRNA. The left background represents number of transcription factors of target genes of up-regulated miRNA. The right background on behalf of number of transcription factors of target genes of down-regulated miRNA. (B) E-value and cross ratio statistics of important regulating transcription factors.