Figures & data
Table 1. Polymer–drug composition of nanoparticles.
Table 2. Effect of PVA concentration (%) in aqueous phase over mean diameter of particle in different formulations where drug and polymer concentration ratio are constant.
Figure 1. FTIR spectroscopy of (a) optimized formulation PLGA-BCL-5E-LS (b) Bicalutamide, and (c) PLGA.
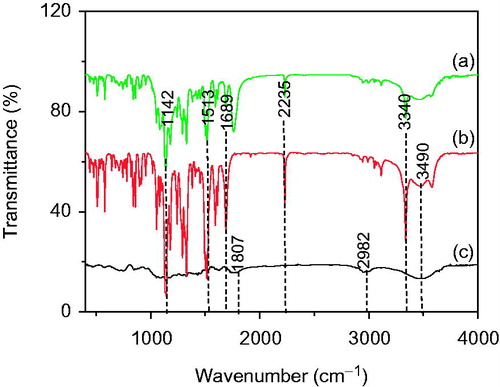
Figure 2. Powder X-ray diffraction patterns of (a) Bicalutamide (b) PLGA and (c) PLGA-BCL-5E-LS nanoparticles powders.
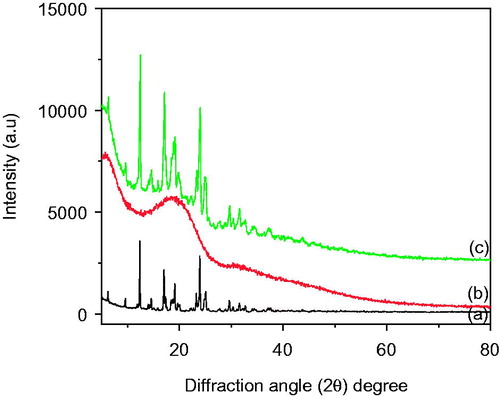
Figure 3. Particle size distribution (intensity) of (a) PLGA nanoparticles without drug and (b) PLGA-BCL-5E-LS nanoparticles as measured by light scattering technique.
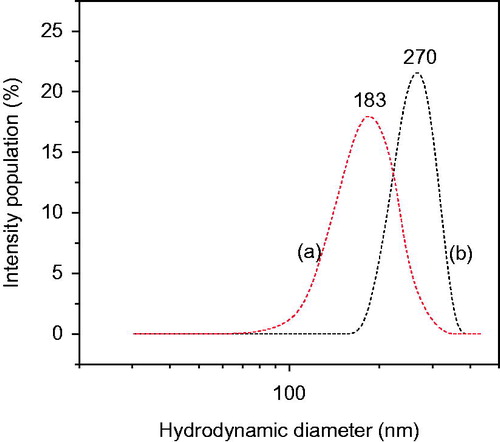
Figure 4. DSC thermogram of (a) pure drug bicalutamide (b) optimized nanoformulation of bicalutamide, and (c) PLGA polymer.
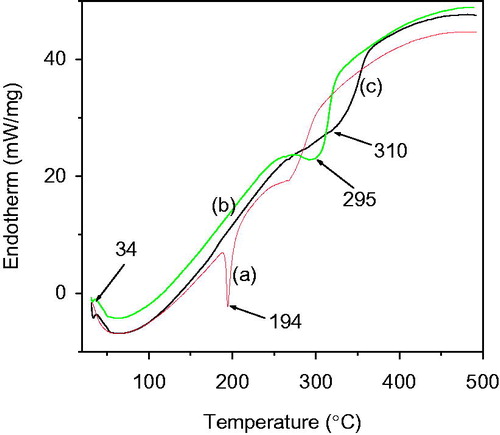
Figure 5. Effect of PVA concentration in the external aqueous phase of the single emulsion used for nanoparticles formulation on the percent of residual PVA associated with nanoparticles.
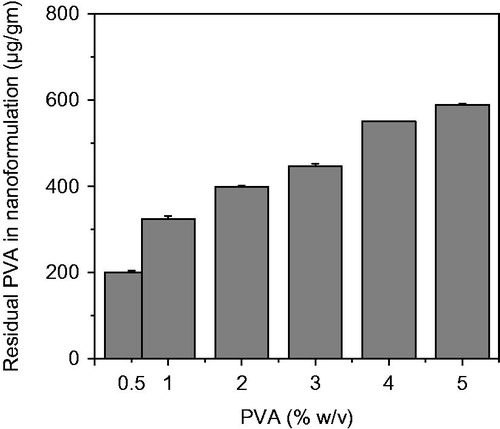
Figure 6. FESEM micrographs of (a) PLGA-BCL-5E-LS in low magnification and (b) PLGA-BCL-5E-LS in high magnification.
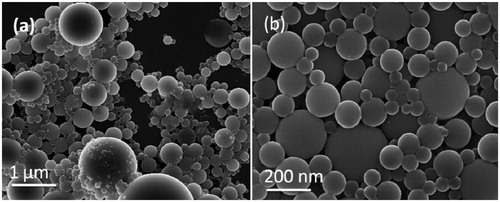
Table 3. Effect of polymer (PLGA) concentration over mean diameter of particle in different batch (Where polymer concentration increased).
Table 4. Percentage yield and loading efficiency of the experimental formulations.
Table 5. Results of optimized nanoparticles formulation(PLGA-BCL-5E-LS).
Figure 7. (a) Cumulative release of pure drug Bicalutamide and (b) from PLGA-BCL-5E-LS as a function of time in PBS at pH 7.4.
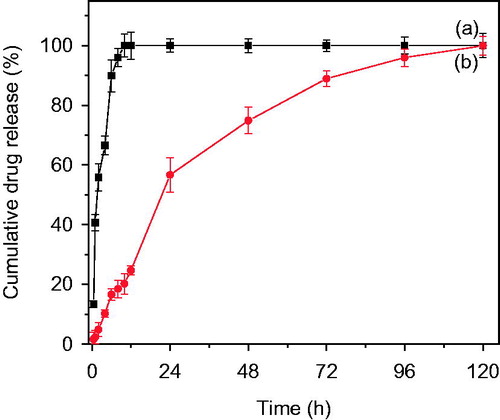
Figure 8. (a) The half maximal inhibitory concentration (IC50) of bicalutamide using DU-145 cell line. (b) DU-145 cell viability of nanoparticles with PLGA-BCL-5E-LS and without bicalutamide drug. Statistical analysis was performed using Student’s t-test to compare the cell viability study between the optimized formulation and free drug groups. The level of significance was p < 0.05.
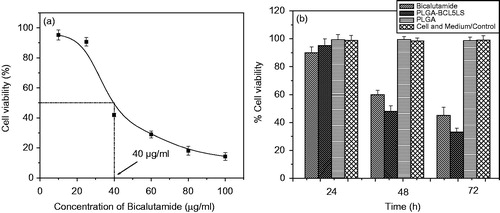
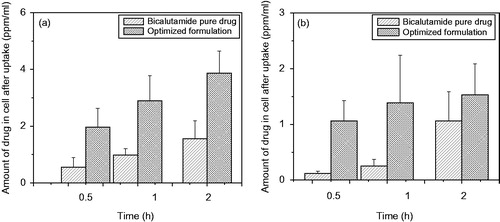
Figure 9. (a) Time-depended cellular uptake of bicalutamide-loaded optimized formulation in time depended manner at 37 °C and (b) the uptake of optimized formulation to DU-145 cells at different time points after incubation at 4 °C. Statistical analysis was performed using Student’s t-test to compare the drug uptake study by cell study between the optimized formulation and free drug groups. The level of significance was p < 0.05.