
Figures & data
Figure 1. Expression cassette value of gene microarray before and after standardization. The horizontal axis shows the sample name, and longitudinal axis shows expression values. Black line is the median of each set of data.
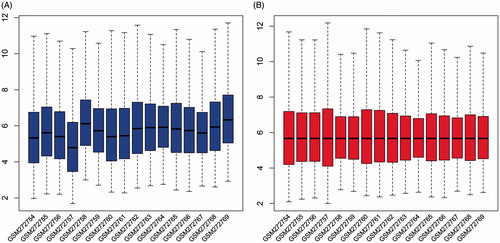
Figure 2. Volcano plot of differentially expressed genes. Ordinate stand for logFC and abscissa for -log10 (P value). Red dot represents the significant differentially expressed gene, and black represents the non-significant differentially expressed genes.
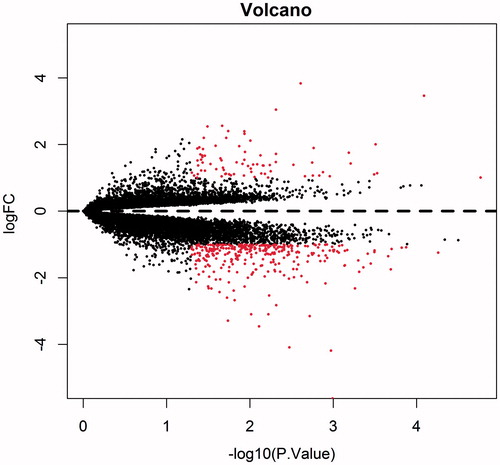
Figure 3. Heat map of significant differentially expressed genes. Horizontal axis stands for the sample name, and the vertical axis for gene name. Blue represents downregulated expression, and red represents up-regulated expression. Color of rectangular on the top represents sample properties, namely, dark blue for bone marrow negative samples and light blue for the bone marrow positive samples.
Table 1. Top ten of differentially expressed genes.
Figure 4. Top ten pathways by KEGG enrichment analysis. The abscissa represents the number of enrichment genes, and ordinate represents the enrichment pathway name. The color of the pillar represents the significance through KEGG enrichment analysis.
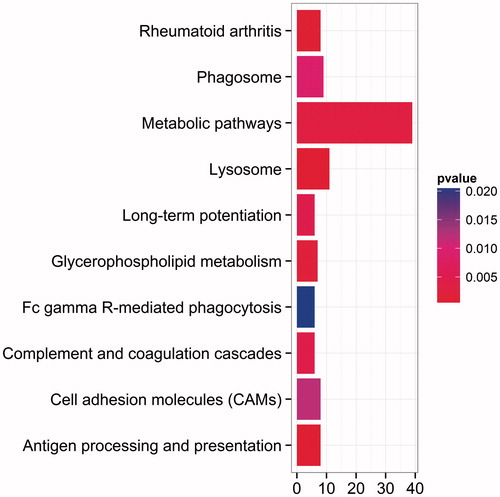
Figure 5. Pathway of hsa04142. Genes with color significant differentially expressed through functional enrichment analysis. Green box represents up-expressed gene, and red for down-expressed genes. log2 (FC) is shown in the upper right corner.
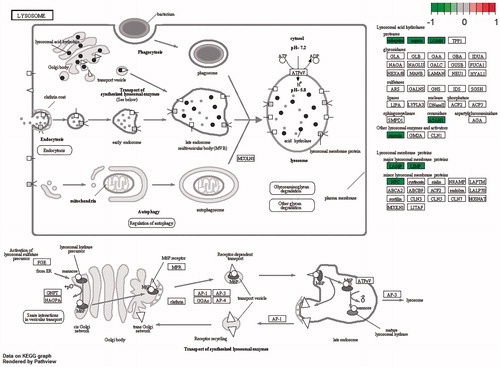
Table 2. GO enrichment analysis.
Table 3. Top ten pathways by KEGG enrichment analysis.
Figure 6. Protein–protein interaction network. Balls represent proteins and line is on behalf of the interaction between genes. Different shape of line inside the balls represents the protein structures. Thread color represents different evidence to prove protein interactions. A red line stands for the presence of fusion evidence; a green line for neighborhood evidence; a blue line for co-occurrence evidence; a purple line for experimental evidence; a yellow line for text mining evidence; a light blue line for database evidence; a black line for co-expression evidence.
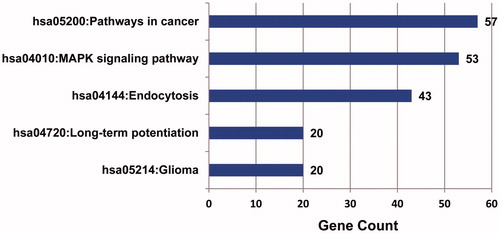
Figure 7. Number of proteins interaction with node protein. The abscissa represents the number of interaction protein, and ordinate represents the core gene name.
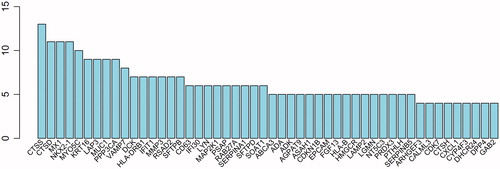
Table 4. Score of protein–protein interaction.