Figures & data
Figure 1. UV-visible absorption spectrum of prepared AgNPs after 60 min.
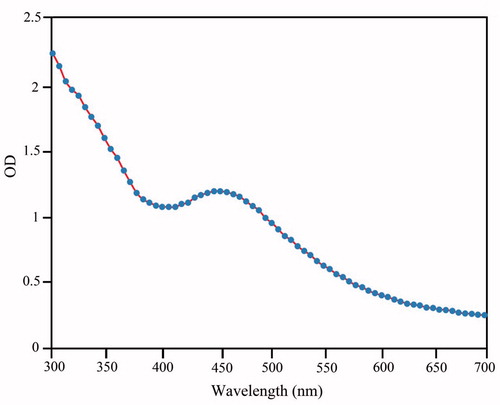
Figure 2. Energy dispersive spectroscopy (EDS) analysis of green synthesized AgNPs.
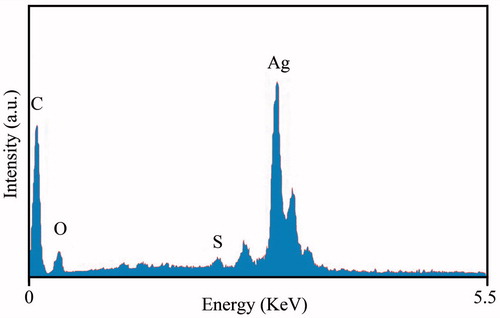
Figure 3. TEM image of green synthesized AgNPs.
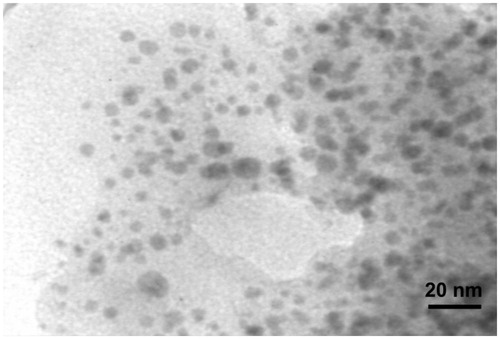
Figure 4. SEM images of (a) AgNPs; (b) IMAB-AgNPs.
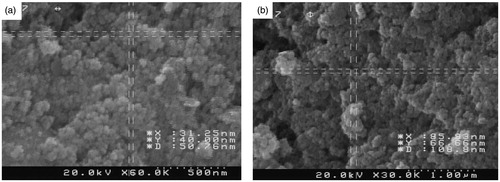
Figure 5. Illustration of DLS (a) and zeta potential (b) analysis of green synthesized silver nanoparticles.
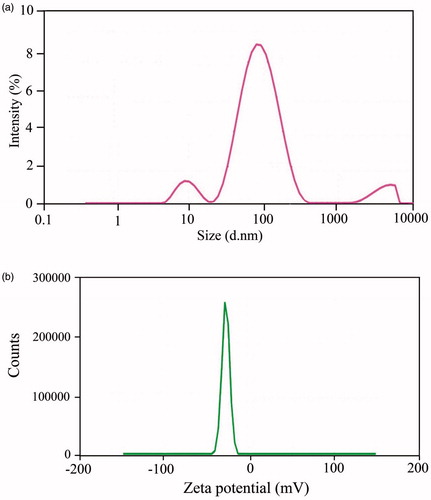
Figure 6. Illustration of DLS (a) and zeta potential (b) analysis of imatinib-loaded silver nanoparticles.
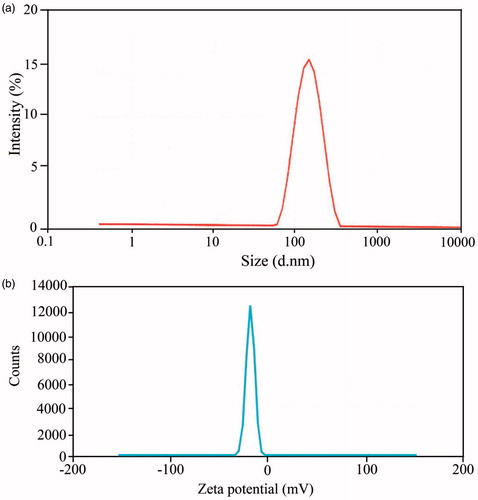
Figure 7. FTIR spectrum of (a) IMAB-AgNPs; (b) IMAB; (c) extract; (d) AgNPs.
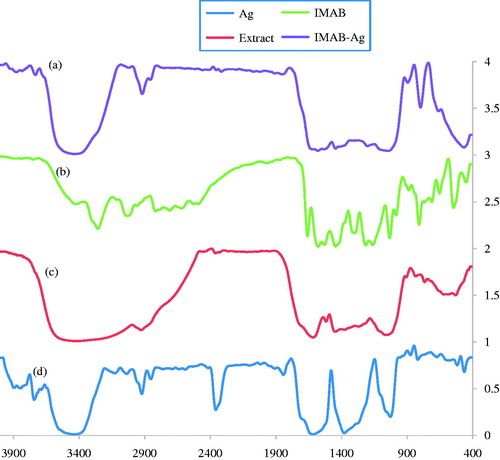
Figure 8. In vitro release study for IMAB-AgNPs.
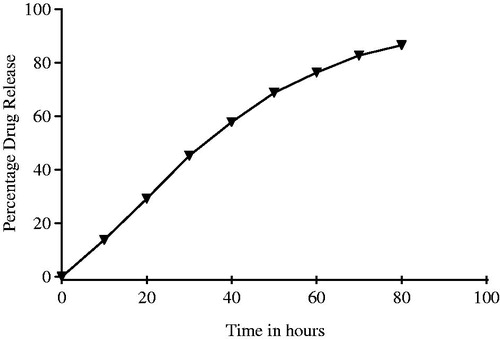
Figure 9. In vitro xytotoxycity of AgNPs, IMAB, IMAB-AgNPs against breast cancer MCF-7 cells after incubation of 24 h. The data were reported as the mean ± standard error of the mean (SEM) from three independent experiments. Results were statistically analyzed with a Student′s t-test (*p < 0.05; **p < 0.01;***p < 0.001).
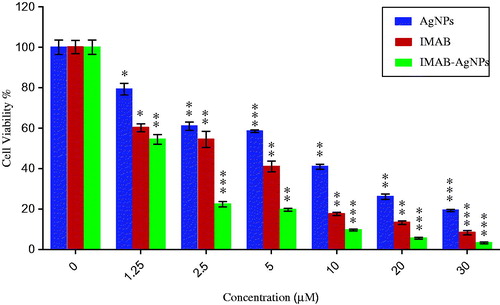
Figure 10. Impact of AgNPs, IMAB, and IMAB-AgNPs to expression of Bax and Bcl-2 mRNA levels in MCF-7 cells.
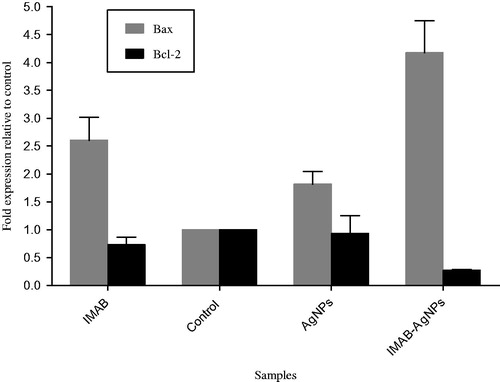
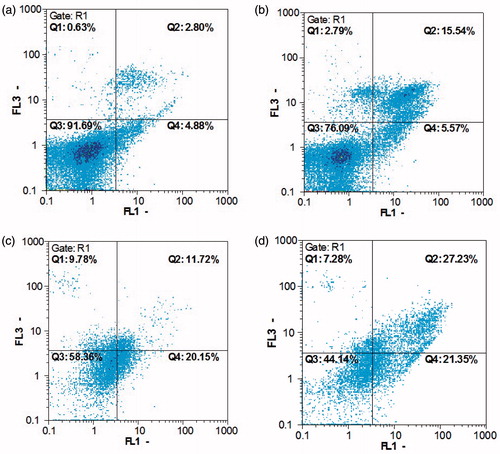
Figure 11. Flow cytometric analysis by annexin V-FLUOS (FL1) in x-axis and PI (FL3) in y-axis double staining of MCF-7 cells treated with AgNPs, IMAB and IMAB-AgNPs at 24 h. Dot plots of annexin V/PI staining are shown in (a) untreated MCF-7 cells; (b) MCF-7 cells treated with AgNPs; (c) MCF-7 cells treated with IMAB; (d) MCF-7 cells treated with IMAB-AgNPs.