Figures & data
Figure 1. Scanning electron microscopic (SEM) image of polymeric microparticle.
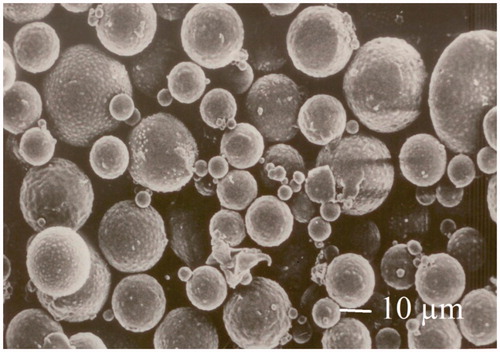
Table 1. Effect of formulation parameters on particle size and entrapment efficiency.
Figure 2. % Drug release with respect to time. Values expressed as mean ± SD (n = 3).
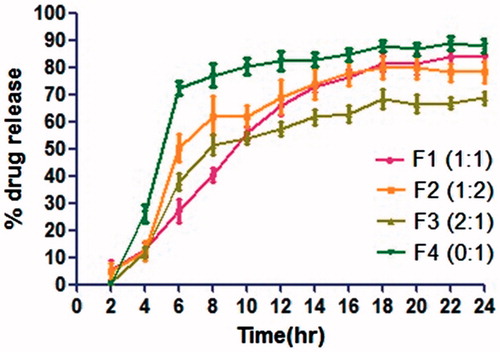
Table 2. Drug release kinetics of different formulations.
Table 3. Macroscopic scoring for evaluation of disease in different treatment groups.
Table 4: Scoring chart for the evaluation of disease.
Figure 3. Effect of embelin on MPO level of acetic acid induced colitis in female wistar rats. Values are given as mean ± SEM; values are statistically significant at ap < 0.05 as compared to normal and bp < 0.05 as compared to colitis control rats.
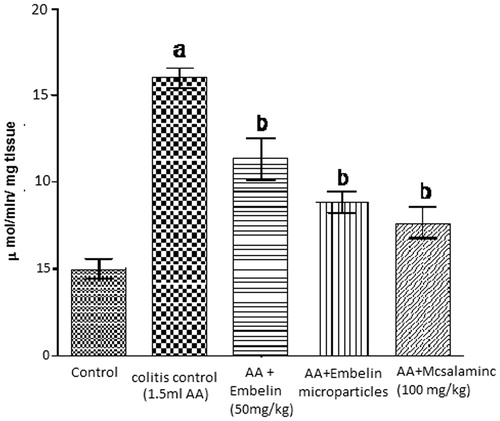
Figure 4. Effect of embelin on LPO level of acetic acid induced colitis in female wistar rats. Values are given as mean ± SEM; values are statistically significant at ap < 0.05 as compared to normal and bp < 0.05 as compared to colitis control rats.
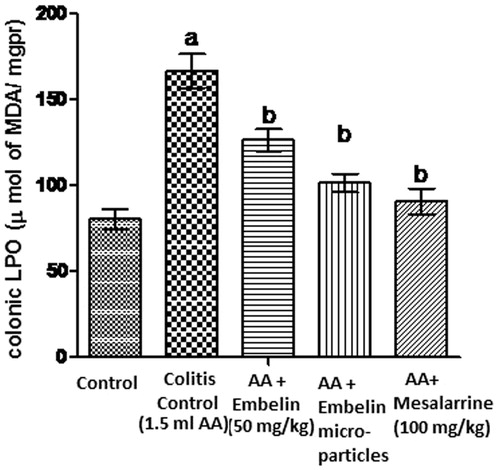
Figure 5. Effect of embelin on GSH level of acetic acid induced colitis in female wistar rats. Values are given as mean ± SEM; values are statistically significant at ap < 0.05 as compared to normal and bp < 0.05 as compared to colitis control rats.
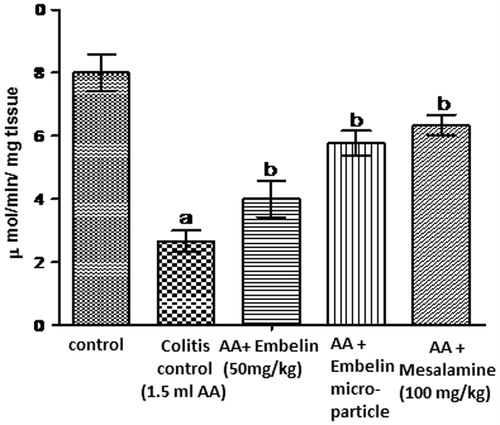
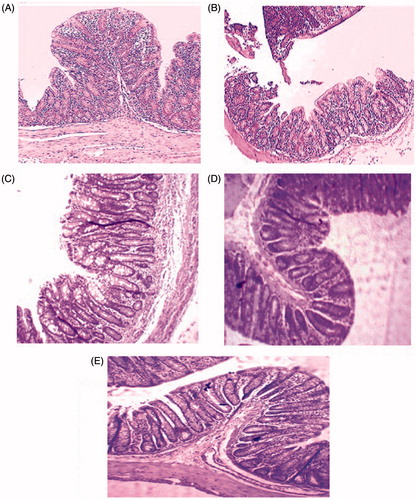
Figure 6. (A) Normal control. (B) Colitis control. (C) Plain embelin (50 mg/kg)+acetic acid. (D) Embelin-loaded microspheres + acetic acid. (E) Standard drug, i.e., mesalamine (100 mg/kg)+acetic acid.