Figures & data
Figure 1. Various steps included in QbD approach.
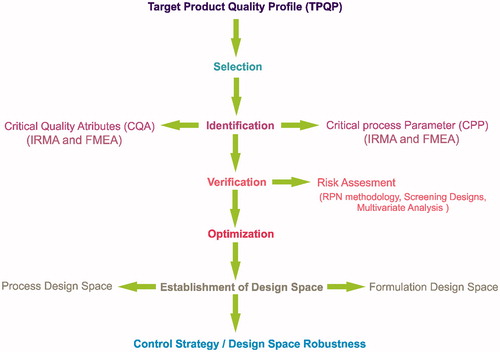
Figure 2. Ishikawa diagram.
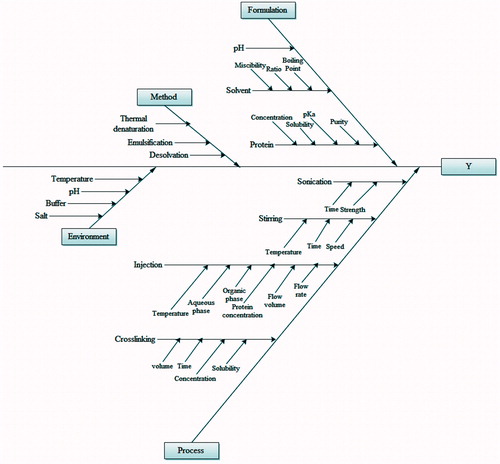
Table 1. RPN for high-risk factors affecting TPQP.
Table 2. Plackett–Burman screening design.
Figure 3. (A) Half normal plots for response Y, Y2, and Y3; (B) actual vs. predicted plot for response Y, Y2, and Y3; (C) sorted parameter estimates for response Y (particle size); (D) sorted parameter estimates for response Y2 (PDI); (E) sorted parameter estimates for response Y3 (yield).
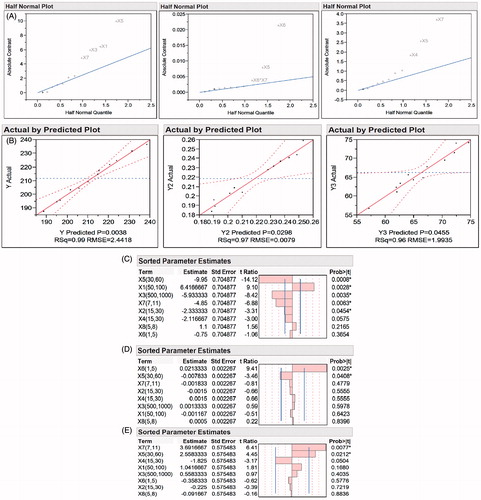
Figure 4. (a) Contour plots showing the effect of significant variables on particle size and PDI and (b) contour plots showing the effect of significant variables on yield.
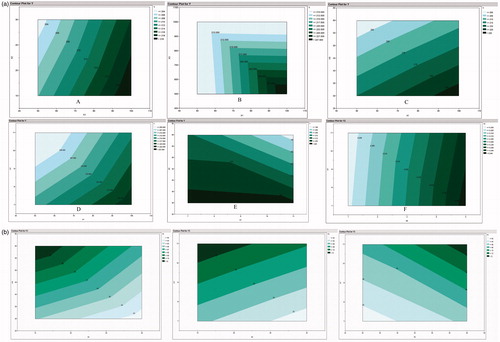
Table 3. ANOVA results for response Y, Y2, and Y3.
Figure 5. Prediction plot showing the predicted value of each response with desirability value for the Placket–Burman design.
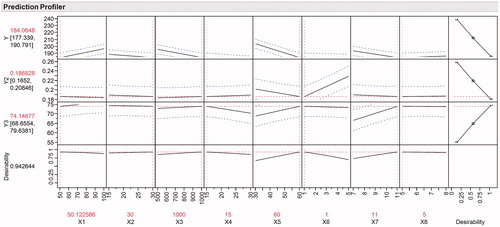
Table 4. Custom design for study of design robustness.
Figure 6. (A) Actual vs. predicted plot for response and ANOVA values for Y, Y2, and Y3 for custom design; (B) half normal plots for response Y, Y2, and Y3 obtained from custom design; (C) sorted parameter estimates for response Y, Y2, and Y3 for custom design.
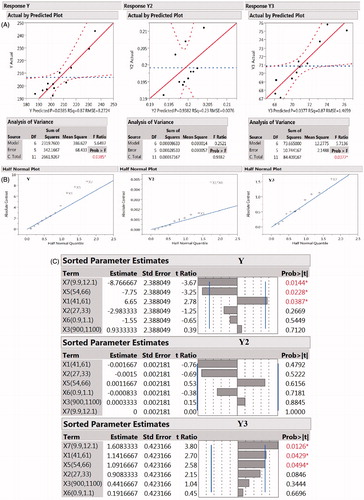
Table 5. Optimized values ranges for each variable (factor) for formulation of lactoferrin nanoparticle.
Figure 7. TEM image of Lf-NPs.
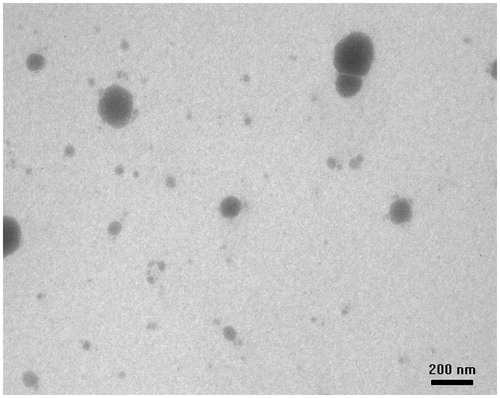
Figure 8. Cell viability assay of Lf, curcumin, and CLf-NPs.
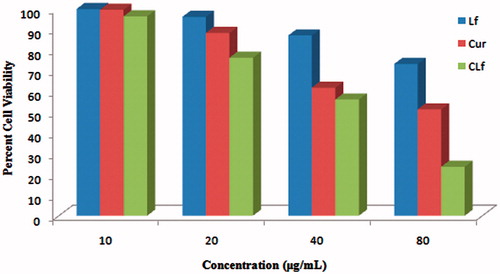
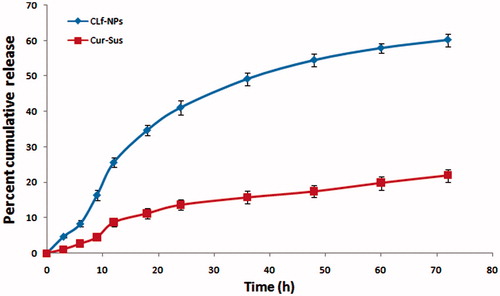
Figure 9. In vitro drug release from CLf-NPs.