Figures & data
Table 1. Actual experiments with coded factor levels for optimization process and pharmacotechnical properties of EGVs.
Table 2. Formulation design and characterization for the preparation of triamcinolone acetonide (TA) loaded gels.
Figure 1. (A) In vitro release profiles of triamcinolone acetonide in phosphate buffer, pH 6.8 in 8 h using dialysis membrane; (B) In vitro cumulative permeability profiles of different gel formulations in phosphate buffer, pH 6.8.
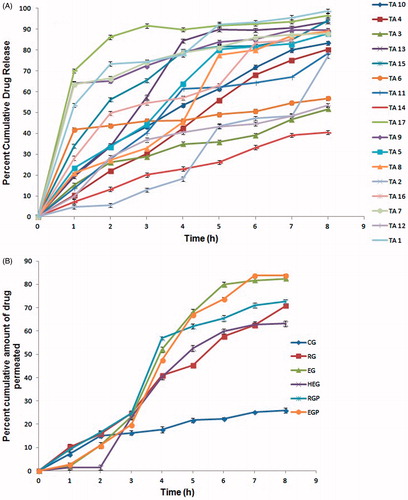
Figure 2. Transmission electron micrographs of (A) Reference ethosomes, RE; (B) Ethosomal glycolic vesicles, TA10.
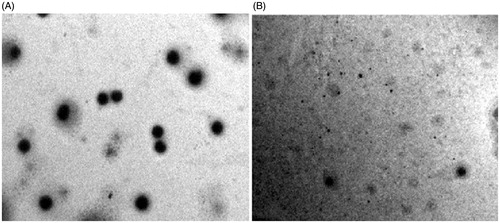
Figure 3. Skin histological micrographs (A) Control skin; (B) EGVs treated skin.
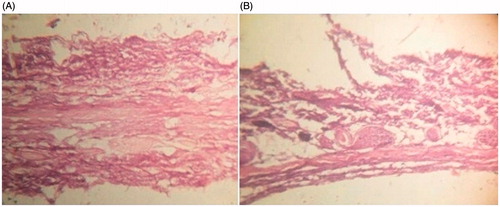
Table 3. Comparative stability investigation of optimized ethosomal glycolic vesicles (TA10) and reference ethosomes (RE).
Figure 4. Formulation optimization via Design-Expert software showing (A) Desirability ramp for optimization of vesicles; (B) Bar graphs; (C) Contour plot for optimization; (D) Overlay plot from graphical optimization technique.
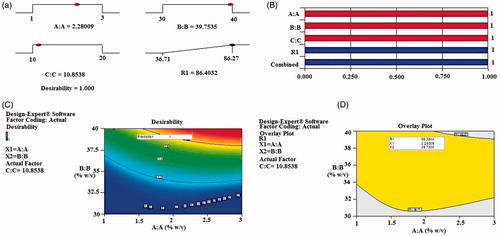
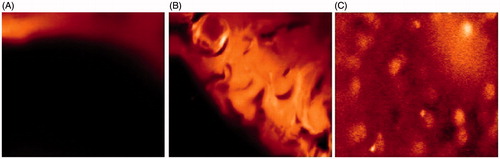
Figure 5. Confocal photomicrograph of (A) Control gel; (B) Reference ethosomal gel; (C) ethosomal glycolic vesicular gel through confocal laser scanning microscope at 100×.