
Figures & data
Table 1. Formulation code and composition used for the PLGA nanoparticles.
Table 2. Mean particle size, zeta potential, and polydispersity index of various formulations.
Figure 1. Differential scanning calorimetry thermogram. (A) Drug-loteprednol etabonate, (B) poly(d,l-lactide-co-glycolide), (C) physical mixture of drug and polymer, and (D) poly(d,l-lactide-co-glycolide) loaded loteprednol etabonate nanoparticles.
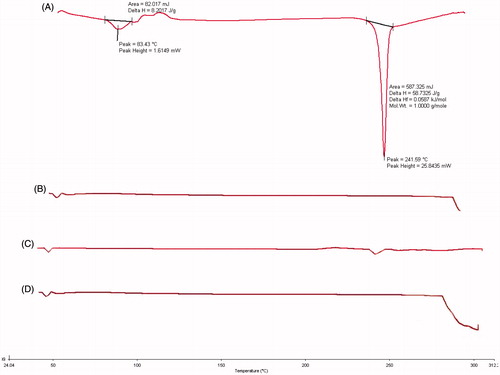
Figure 2. X-ray diffraction diffractograms. (A) Loteprednol etabonate, (B) poly(d,l-lactide-co-glycolide), (C) physical mixture of drug and polymer, and (D) poly(d,l-lactide-co-glycolide) loaded loteprednol etabonate nanoparticles.
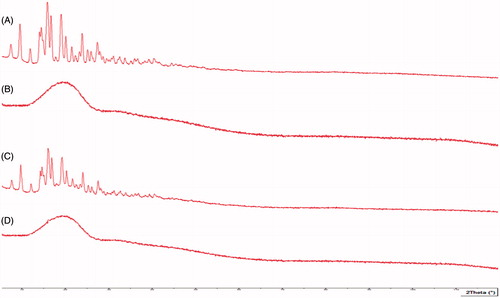
Figure 3. Transmission electron micrograph of optimized nanoparticulate formulation.
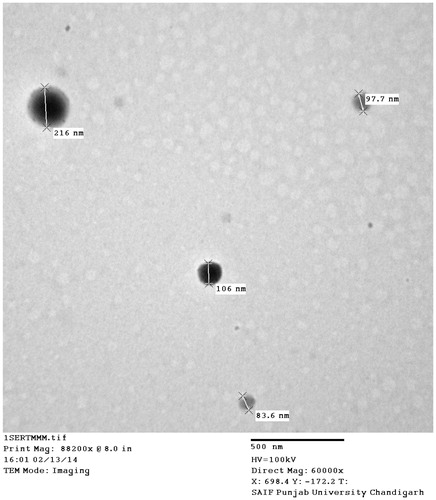
Figure 4. Confocal images of excised goat cornea illustrating the depth penetration of rhodamine labeled nanoparticle into the deeper layers of corneal epithelium at (10–75 μm). The uniform fluorescence intensity was observed from first to last section.
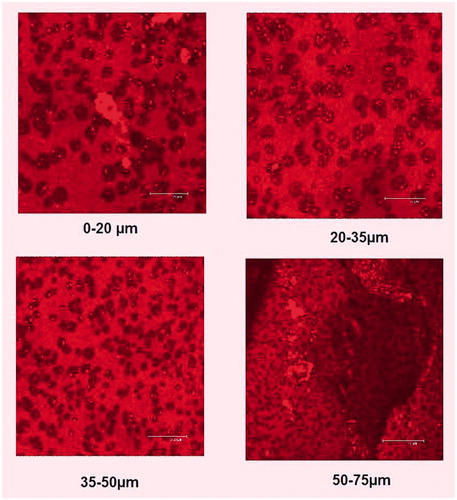
Figure 5. Confocal laser scanning micrograph of poly(d,l-lactide-co-glycolide) loaded loteprednol etabonate nanoparticles penetrated across the excised goat cornea in which X-axis and Y-axis show the depth of penetration and intensity of fluorescence, respectively.
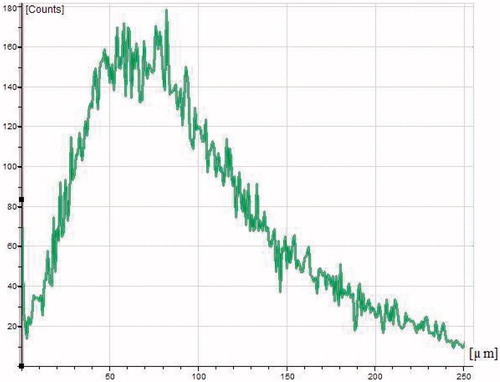
Figure 6. Digital optical microscopy image of excised goat cornea. (A) Control solution and (B) nanoformulation at 10–40×. The corneal tissue exhibited no change in cellular structure and morphology of normal cell.
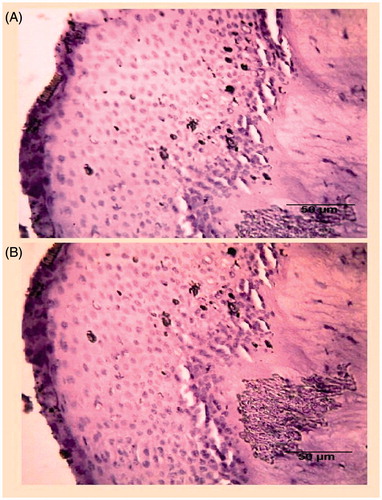
Figure 7. Ex vivo transcorneal permeation studies of optimized poly(d,l-lactide-co-glycolide) loaded loteprednol etabonate nanoparticle formulations and loteprednol etabonate suspension in STF (pH 7.4) at 37 °C.
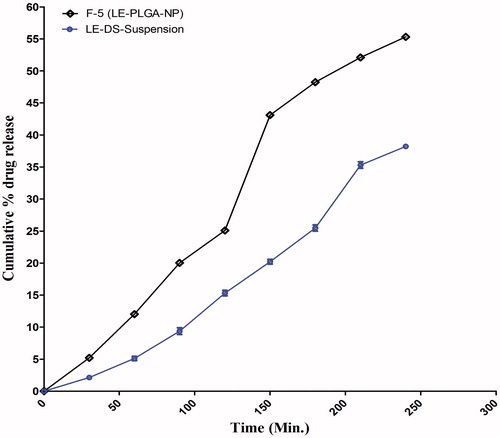
Table 3. Effect of different temperature on the particle size and entrapment efficiency of drug loaded PLGA-NPs. Results are presented as mean ± SD (n = 3).