
Figures & data
Figure 1. SEM images (A, B) of CHT/SS (1:0.01, w/v) composite 3D porous scaffolds.
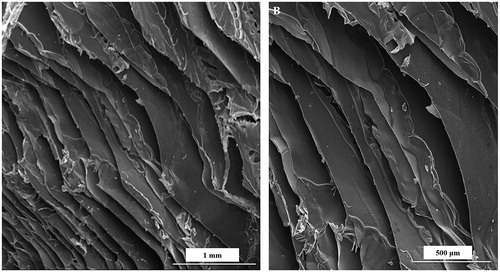
Figure 2. SEM images of CHT/SS/100nZnO (A–C) and CHT/SS/250nZnO (D–F) composite 3D porous scaffolds and EDX scan spectra of (I) CHT/SS/100nZnO, (II) CHT/SS/250nZnO.
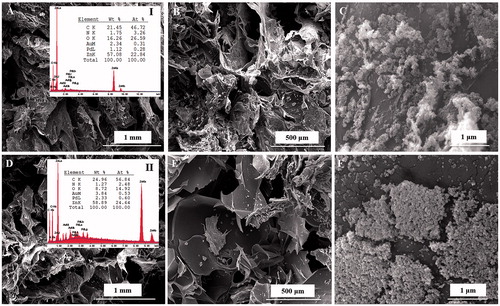
Figure 3. SEM images of CHT/SS/0.01LA (A, B) and CHT/SS/0.02LA (C, D) composite 3D porous scaffolds and EDX scan spectra of (I) CHT/SS/0.01LA and (II) CHT/SS/0.02LA.
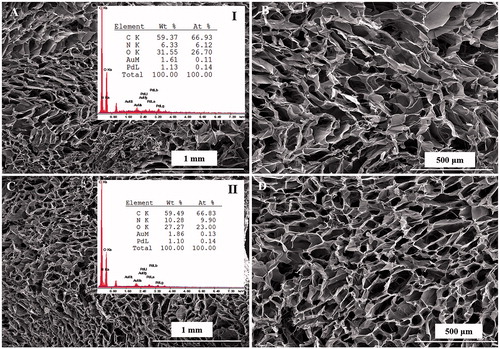
Figure 4. FTIR spectrum of CHT/SS, CHT/SS/100nZnO and CHT/SS/250nZnO (A) and CHT/SS/0.01LA and CHT/SS/0.02LA (B) 3D porous scaffolds.
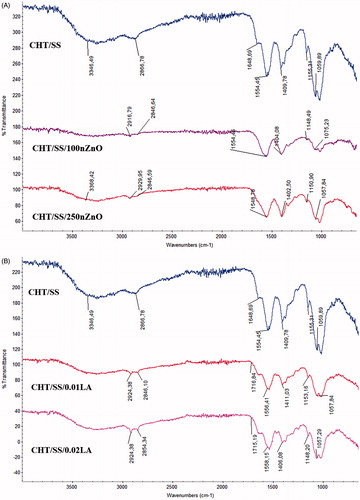
Figure 5. Stress-deformation curves of CHT/SS, CHT/SS/100nZnO, CHT/SS/250nZnO, CHT/SS/0.01LA and CHT/SS/0.02LA 3D porous scaffolds in dry-state.
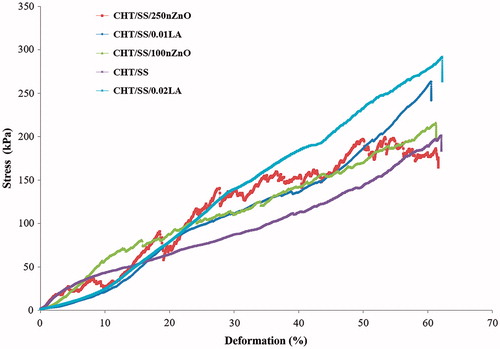
Figure 6. Pore histograms of (A) CHT/SS, (B) CHT/SS/100nZnO, (C) CHT/SS/250nZnO, (D) CHT/SS/0.01LA, (E) CHT/SS/0.02LA 3D porous scaffolds and (F) porosity percent of 3D porous scaffolds.
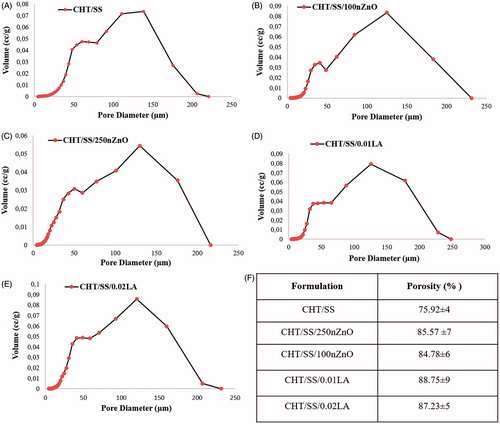
Figure 7. In vitro release profile of CHT/SS/250nZnO and CHT/SS/100nZnO 3D porous scaffolds.
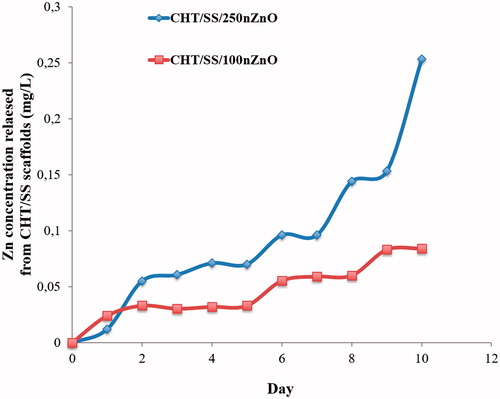
Figure 8. (A) In vitro cytotoxicity and (B) the cell proliferation of HaCaT cells on the pristine CHT/SS-, nZnO-, and LA-reinforced CHT/SS 3D porous scaffolds. Values are mean SEM; n = 3; *p < 0.005, **p < 0.05.
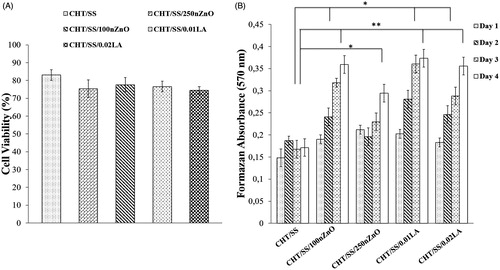
Figure 9. SEM images of the adhered HaCaT cells on the pristine (A) CHT/SS, (B) CHT/SS/0.01LA, (C) CHT/SS/0.02LA, (D) CHT/SS/100nZnO, and (E) CHT/SS/250nZnO. Scale bars are 100 and 200 μm.
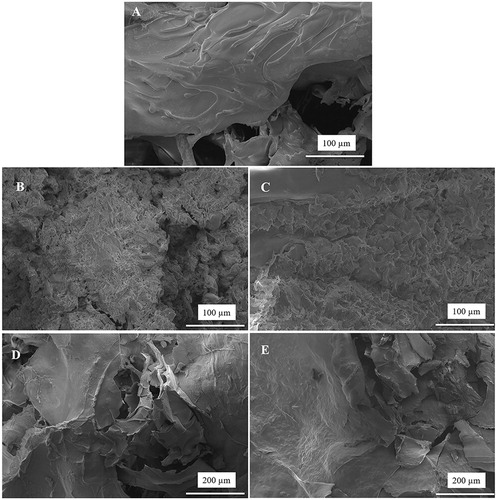
Figure 10. Fluorescence microscopy images of HaCaT cells after 24 h incubation with the extraction medium of 3D-porous scaffolds. (A) CHT/SS, (B) CHT/SS/250ZnO, (C) CHT/SS/250ZnO, (D) CHT/SS/0.01LA, and (E) CHT/SS/0.02LA. Scale bars are100 μm.
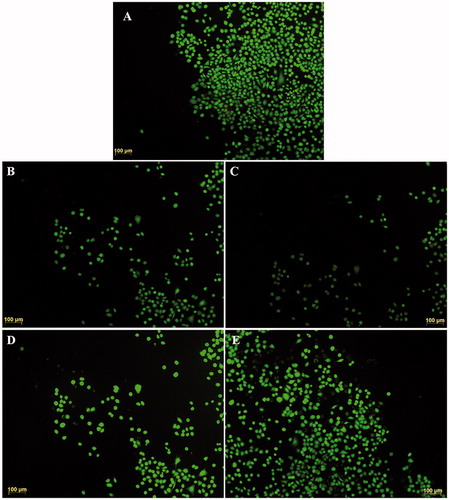
Figure 11. Antibacterial activity of pristine and composite CHT/SS 3D porous scaffolds containing nZnO and LA against E. coli and S. aureus.
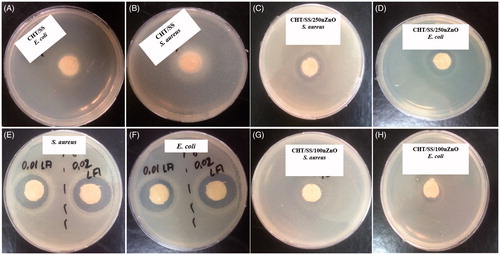
Table 1. Inhibition zone diameter of pristine and composite CHT/SS 3D porous scaffolds containing nZnO and LA in different concentrations.