Figures & data
Figure 1. (A) (a) Silver nitrate solution alone (b) Silver nitrate solution with T. arjuna extract at time 0 min (c) Silver nitrate solution with T. arjuna extract after 20 min, showing formation of TA-AgNPs; (B) UV-vis spectrum of the TA-AgNPs.
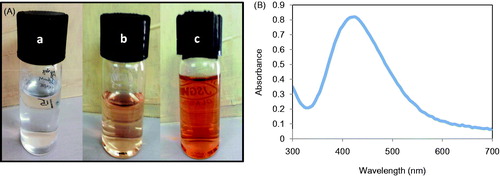
Figure 2. (A) Representative DLS spectrum of TA-AgNPs, the size here is ∼65 nm. (B) FESEM image of TA-AgNPs. (C) EDS spectrum of TA-AgNPs.
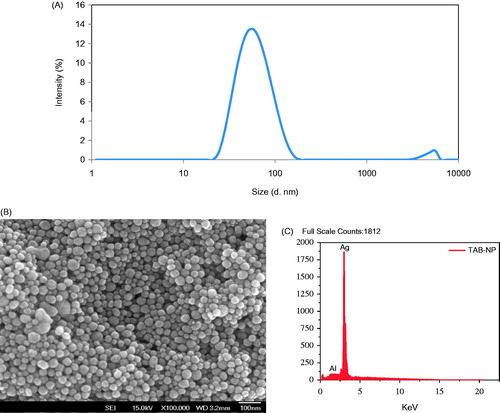
Figure 3. XRD spectrum of TA-AgNPs synthesized using T. arjuna bark extract.
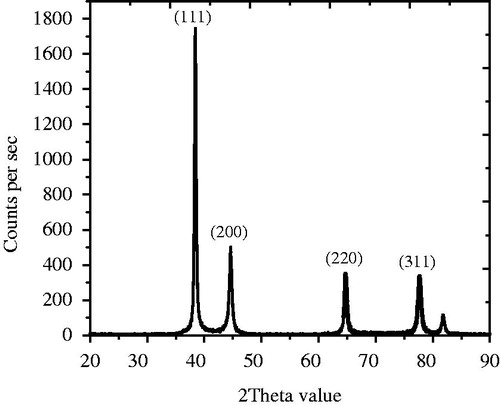
Figure 4. FT-IR spectra of T. arjuna bark extract (TA bark extract only) and TA-AgNPs.
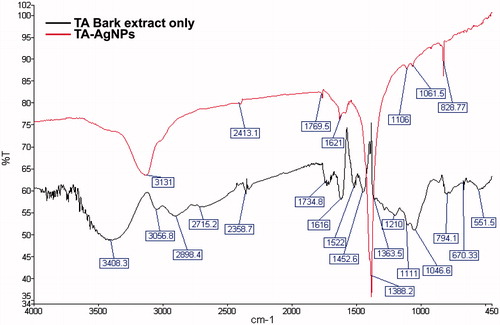
Figure 5. UV-vis spectra of TA-AgNPs synthesized using 1 mM silver nitrate solution at different time intervals.
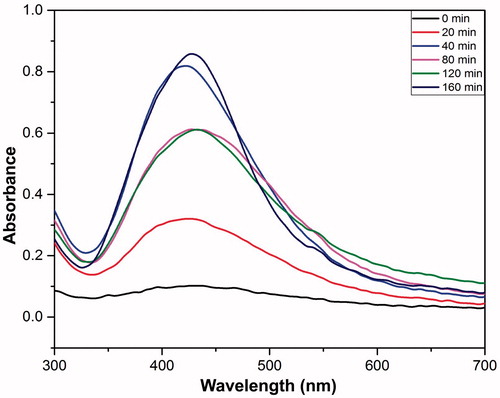
Figure 6. UV-vis spectra of TA-AgNPs synthesized at different reaction temperatures.
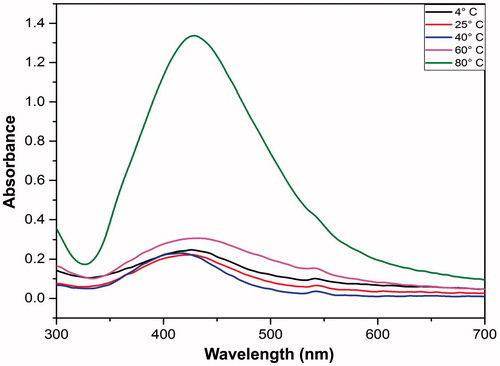
Figure 7. UV-vis spectra of TA-AgNPs synthesized using different concentrations of silver nitrate solution.
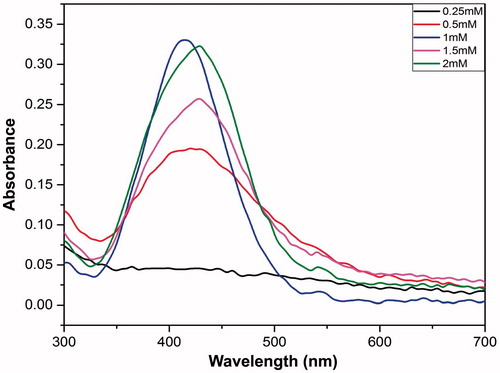
Figure 8. UV-vis spectra of TA-AgNPs synthesized at different concentration ratio of T. arjuna bark extract to 1 mM silver nitrate solution.
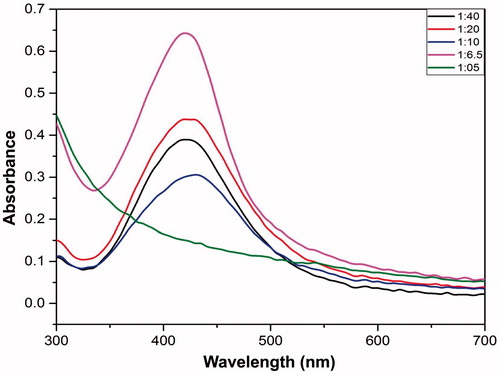
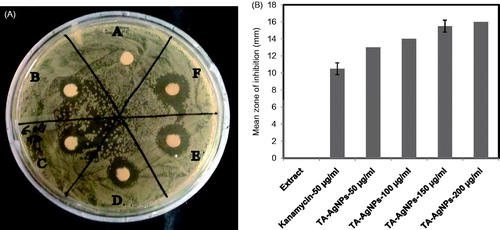
Figure 9. Representative results of antimicrobial activity of TA-AgNPs using agar disc diffusion assay. (a) Antimicrobial activity of TA-AgNPs against E. coli at different concentration (A) Extract only, (B) Kanamycin 50 μg/ml, (C) TA-AgNPs-50 μg/ml, (D) TA-AgNPs-100 μg/ml, (E) TA-AgNPs-150 μg/ml, (F) TA-AgNPs-200 μg/ml).