Figures & data
Figure 1. The DEGs in atheroma plaque samples compared with those in normal samples. Black plots represent down- and up-regulated genes, red dots were significant differentially expressed genes.
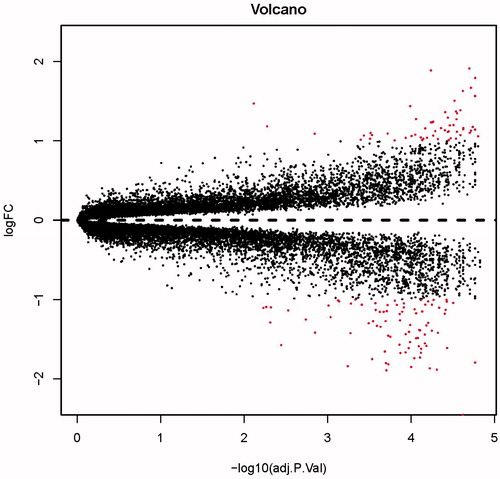
Table 1. Most significant up and down-regulated genes in atheroma plaque.
Figure 2. The top 13 most significantly enriched GO terms of DEGs according to the P value.
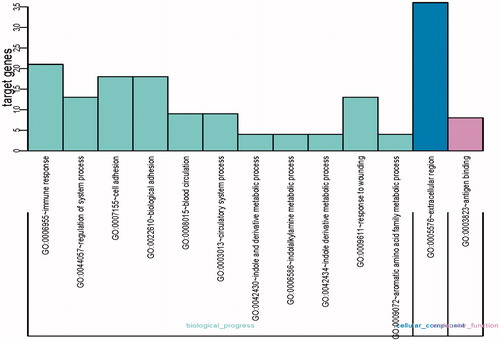
Table 2. The KEGG enriched pathways of the DEGs.
Figure 3. PPI network of DEGs obtained from the STRING database.
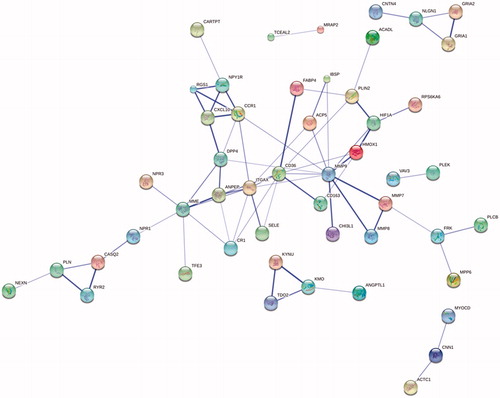
Table 3. Identified key genes in atheroma plaque.
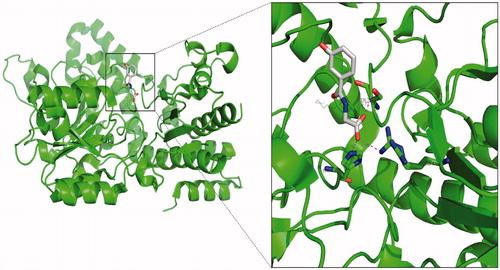
Figure 4. Structural character of kynureninase–3-hydroxyhippuric acid complex.