Figures & data
Table 1. The primer of the shRNA.
Figure 1. The map of pYr-1.1 plasmid.
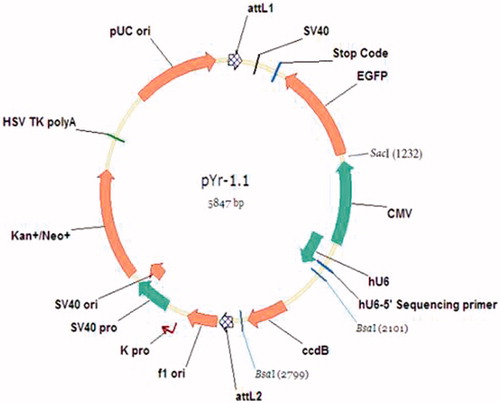
Figure 2. pYr-1.1 plasmid digest with BASI enzyme. Lane 1: pYr-1.1 plasmid; Lane 2 Marker.
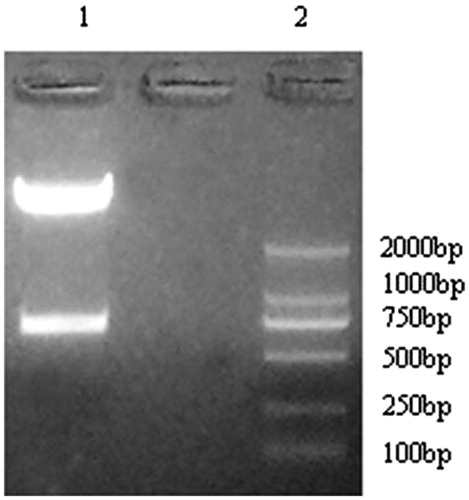
Figure 3. pYr-1.1–CaMKIIγ-shRNA plasmid digest with BASI enzyme. Lane 1. Marker. Lane 2, 3, 4 pYr-CaMKIIγ-shRNA-1 three different bacterial clones. Lane 5, 6, 7 pYr-CaMKIIγ-shRNA-2 three different bacterial clones. Lane 8, 9, 10 pYr- shRNA-CaMKIIγ-3 three different bacterial clones.
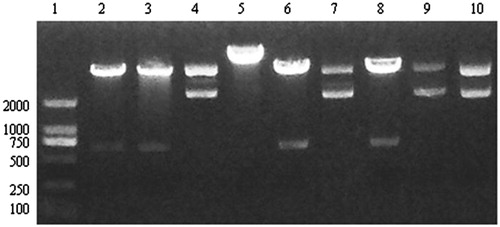
Figure 4. The sequence (underline) of the pYr-1.1-CaMKIIγ-shRNA-1, pYr-1.1-CaMKIIγ-shRNA-2 and pYr-1.1-CaMKIIγ-shRNA-3.
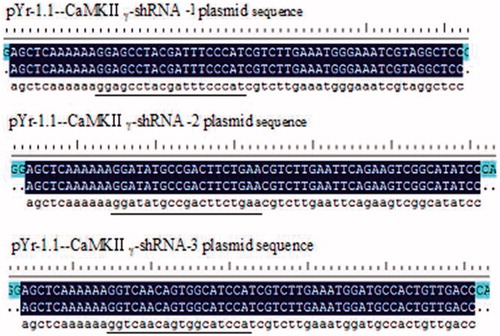
Figure 5. pAd-CaMKIIγ-shRNA digested. Lane 1, pAd-CaMKIIγ-shRNA-1 Lane 2, pAd-CaMKIIγ-shRNA-2.
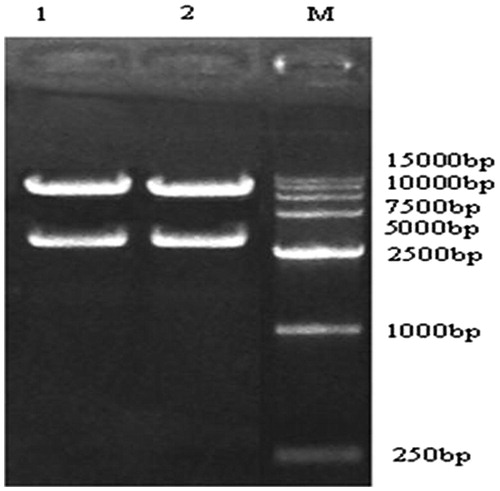
Figure 6. PCR verify the production of recombinant adenovirus in 293 cells. Lane 1, pAd/PL-DEST vector. Lane 2, pAd-CaMKIIγ-shRNA. Lane 3, negative control.
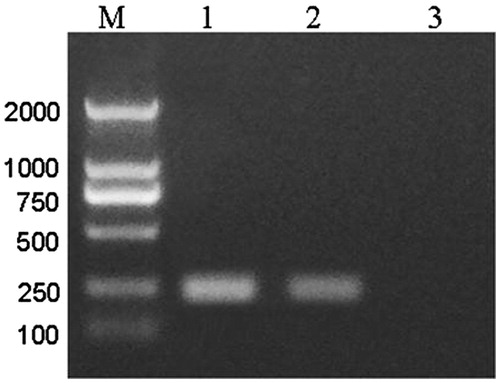
Figure 7. Infection efficiency of the pAd-CaMKIIγ-shRNA adenovirus under fluorescence microscope, scale bar =25 μm. A: DRG cells under visible light (×20). B: DRG cells under green fluorescence (×20).
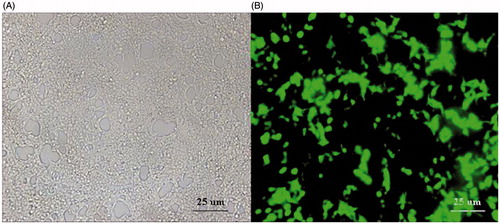
Figure 8. The expression of CaMKIIγ mRNA (mean ± sd, n = 6). *P < 0.01 versus normal DRG cells, #P < 0.01 versus empty plasmid DRG cells.
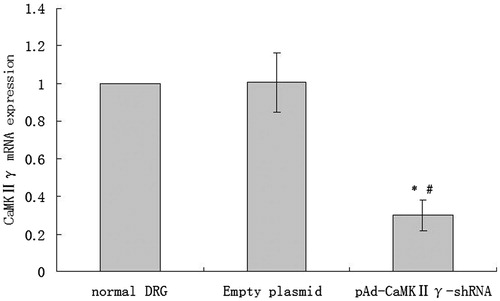
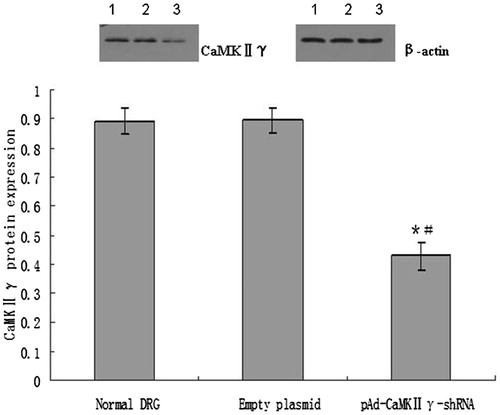
Figure 9. The expression of CaMKIIγ protein (mean ± sd, n = 6). *P < 0.01 versus normal DRG cells, #P < 0.01 versus empty plasmid DRG cells. Lane 1, the expression of CaMKIIγ protein in normal DRG cells. Lane 2, the expression of CaMKIIγ protein in empty DRG cells. Lane 3, the expression of CaMKIIγ protein in pAd-CaMKIIγ-shRNA adenovirus DRG cells.