Figures & data
Table 1. Formulation of microemulsions containing paeonol–menthol eutectic mixture.
Figure 1. The saturated solubility of paeonol and eutectic systems in water (n = 3).
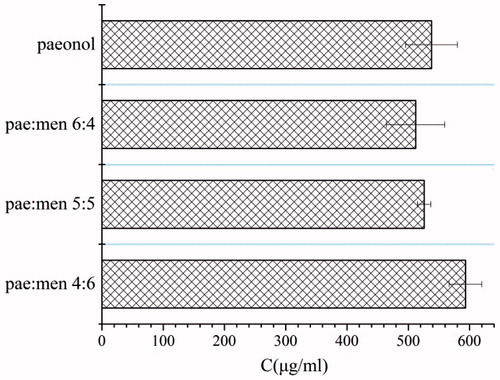
Figure 2. Pseudo-ternary phase diagrams of microemulsions with different eutectic mixtures.
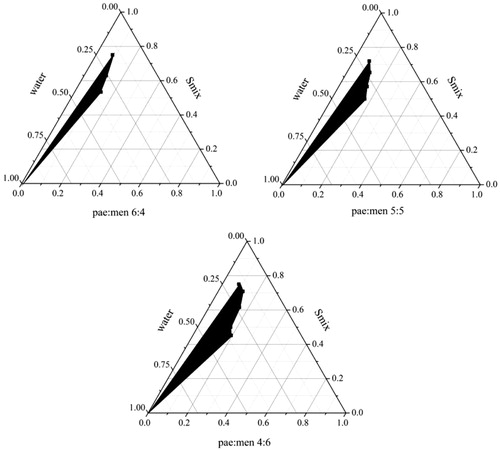
Table 2. Droplet size and polydispersity index (PI) of microemulsions at different temperature (n = 3).
Figure 3. TEM images of (A) microemulsion and (B) microemulsion-based gel.
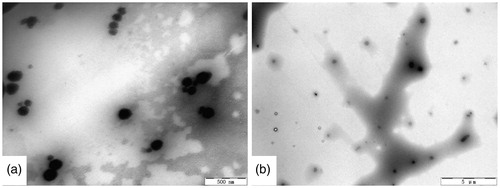
Figure 4. The viscosity change of microemulsions at different temperatures (n = 3).
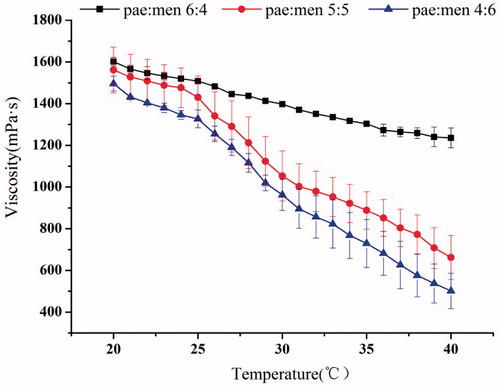
Figure 5. The appearance of microemulsions during a short-term storage (A: initial; B: 3 days; C: 7 days; D: 10 days, and from left to right is pae:men 6:4, 5:5 and 4:6).
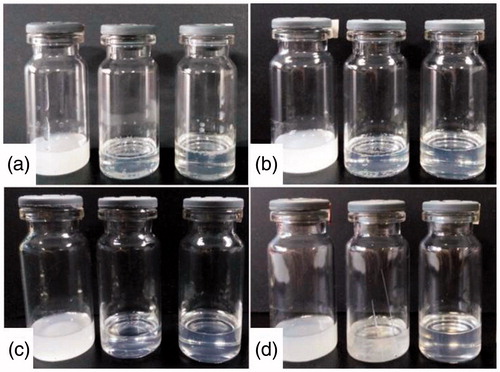
Figure 6. The micrograph of microemulsion-based gels during a short-term storage (magnification 400×).
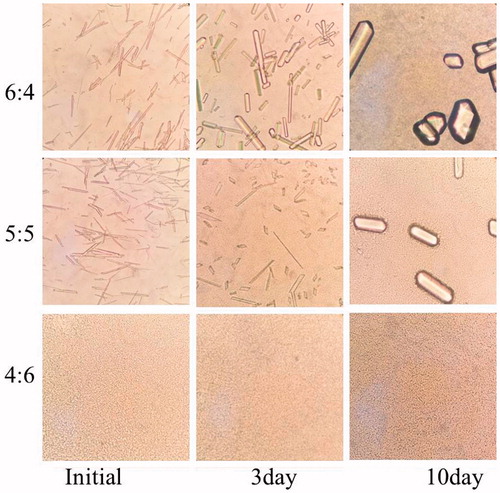
Figure 7. Drug permeation profiles of different formulation gels (n = 6). *P < .05, statistical significance compared with pae + men 4:6 (the paeonol gel). #P < .05, statistical significance compared with the pae:men 6:4 and 5:5.
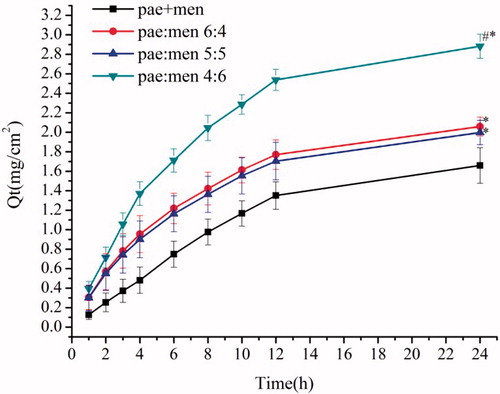
Table 3. In vitro percutaneous penetration parameters of different formulation gels (n = 6).
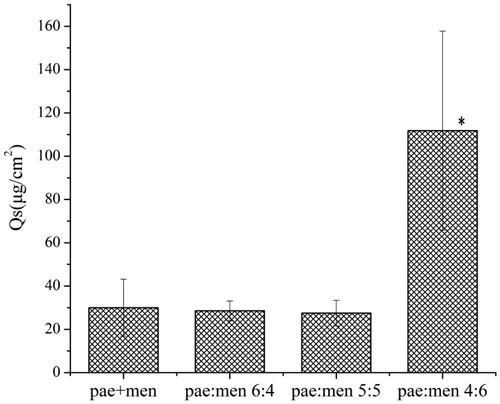
Figure 8. Drug deposition of different gel formulations (n = 6).