Figures & data
Figure 1. miR-126 (A) and GATA4 (B) expressions in different grades of glioma tissue samples. **Compared with low-grade glioma samples, P < .01.
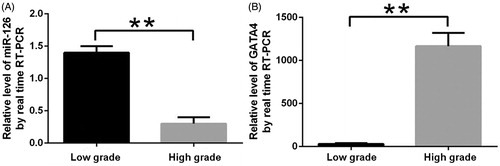
Figure 2. Construction of miRNA-126 expression vector. (A) Amplification of target fragment. M, DNA ladder; 1 and 2, miR-126 precursor; (B) M, DNA ladder; 1 and 2, there are target fragments at ∼400 bp, indicating that the fragment had been inserted into expression vector pcDNA3.1; 3, the fragment had not been inserted into expression vector pcDNA3.1; (C) double digestion results, M, 100 bp plus DNA ladder; i–iv, undigested control plasmids, 1–4, digested plasmids; (D) verification of miR-126 expressions. *P < .05.
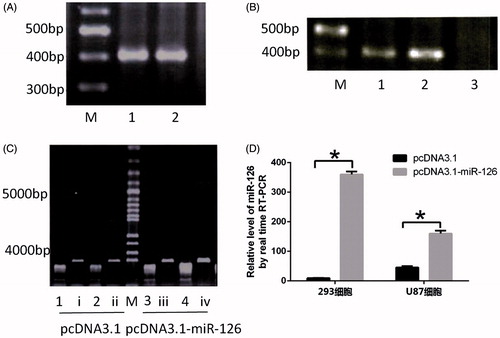
Figure 3. Scratch assay results of (A) U251 cells and (B) U87 cells. L2K group: Blank control group only treated with Lipofectamine 2000; L2K + pcDNA3.1 group: control group treated with Lipofectamine 2000 and vector pcDNA3.1; L2K + pcDNA3.1-miR-126 group: experimental group treated with Lipofectamine 2000 and miR-126 expression vector.
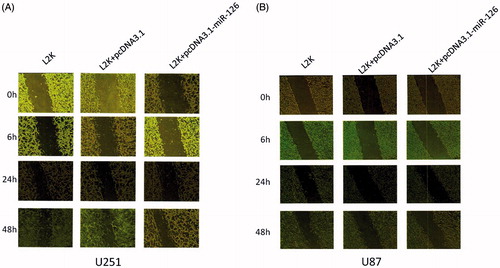
Figure 4. Dual luciferase reporter assay results. (A) Activity of luciferase containing pGL3M-GATA4 3′-UTR after miR-126 was inhibited; (B) GATA4 mRNA expression levels after transfection; (C) GATA4 protein expressions in U87 cells. *Compared with pcDNA3.1 group, P < .05.
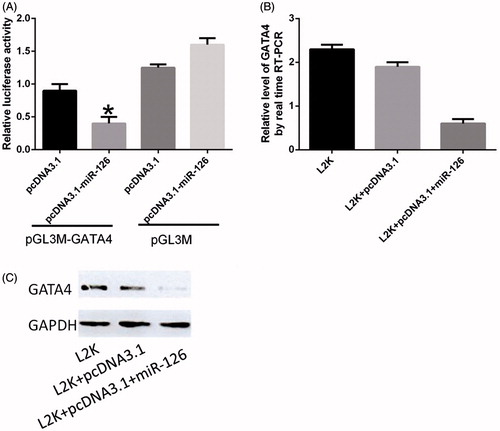
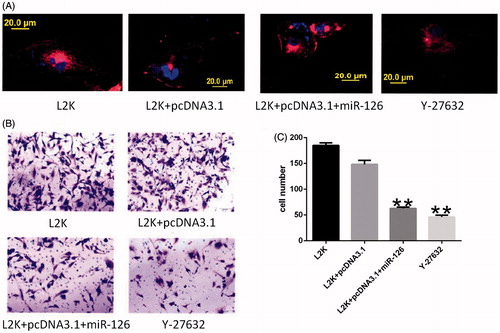
Figure 5. (A) Cytoskeletal changes under fluorescence microscope and (B, C) Transwell invasion assay results. Intracellular F-actin is marked by rhodamine-phalloidin; intracellular DNA is marked by DAPI. **Compared with L2K and L2K + pcDNA3.1 groups, P < .01.