
Figures & data
Figure 1. (a) Color intensity of Hugonia mystax aqueous extract before and after the reduction of silver nitrate (1 mM). The color change indicates Ag+ reduction to elemental nanosilver. (b) UV-visible spectrum of silver nanoparticles after 180 min from the reaction.
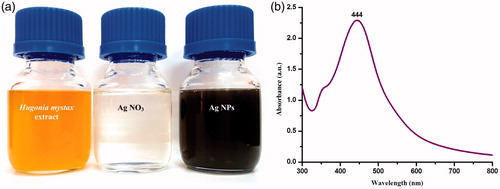
Figure 2. XRD pattern of silver nanoparticles biofabricated using the Hugonia mystax aqueous extract.
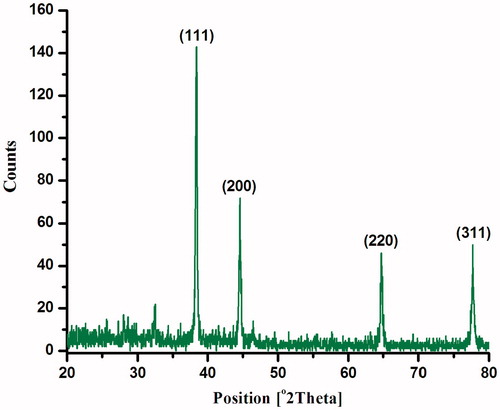
Figure 3. FTIR spectrum of silver nanoparticles biofabricated using the Hugonia mystax aqueous extract.
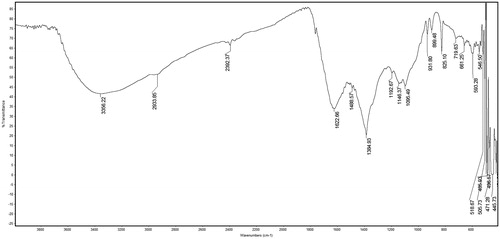
Figure 4. Scanning electron microscopy (SEM) of Hugonia mystax silver nanoparticles (A. 25 000X; B. 50 000X).
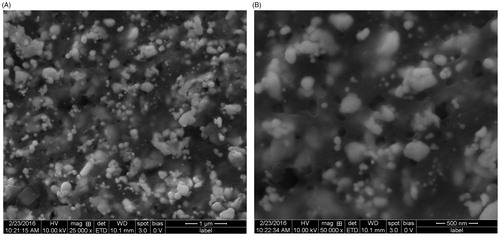
Figure 5. Energy dispersive X-ray (EDX) spectrum of silver nanoparticles biofabricated using the Hugonia mystax aqueous extract, showing presence of different phyto-elements as capping agents.
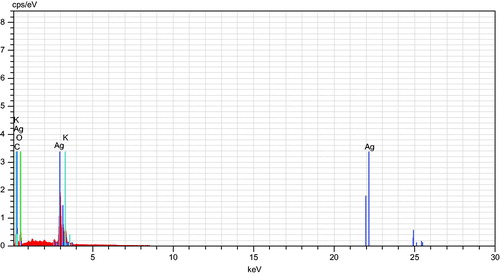
Figure 6. Transmission electron microscopy (TEM) of silver nanoparticles biofabricated using the Hugonia mystax aqueous extract.
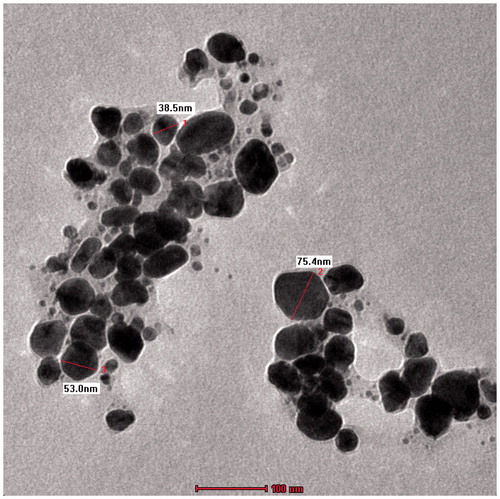
Table 1. Larvicidal potential of Hugonia mystax aqueous leaf extract against the mosquito vectors Anopheles stephensi, Aedes aegypti, and Culex quinquefasciatus.
Table 2. Larvicidal potential of AgNPs synthesized using the Hugonia mystax leaf extract against the Anopheles stephensi, Aedes aegypti, and Culex quinquefasciatus.
Table 3. Effect of Hugonia mystax aqueous leaf extract against three bio-control organisms sharing the same ecological niche of Anopheles and Aedes mosquito vectors.
Table 4. Effect of synthesized AgNPs using the Hugonia mystax leaf extract against three bio-control organisms sharing the same ecological niche of Anopheles and Aedes mosquito vectors.
Table 5. Suitability index of three bio-control organism over young instars of Anopheles stephensi, Aedes aegypti, and Culex quinquefasciatus exposed to Hugonia mystax aqueous leaf extract and AgNPs.