Figures & data
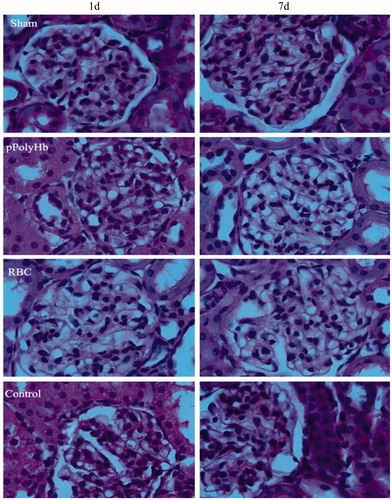
Figure 1. Blood pressure and heart rate in a rat isovolemic hemodilution model. (A) Mean arterial blood pressure (MAP) and (B) heart rate (HR) were monitored every 10 min throughout the experiment. *p < .05 in comparison with baseline; #p < .05 in comparison with the control group.
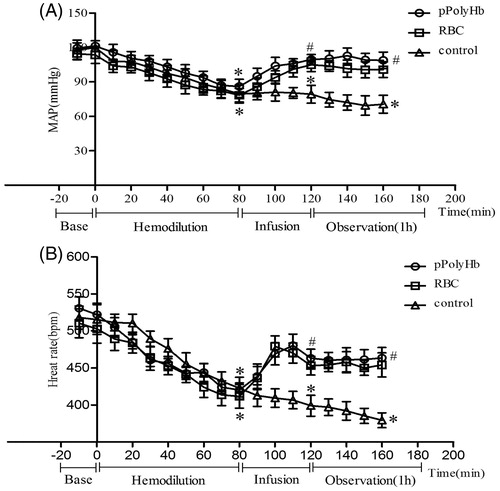
Figure 2. pH, Lactate, , and base excess (BE) values in isovolemic hemodilution model rats. Blood samples were drawn before the start of hemodilution (baseline), at the end of hemodilution, at the end of infusion and after a 1 h observation period (1 h) to assess anaerobic metabolism. Blood gas analysis was performed on an ABL 800 (Radiometer, Copenhagen, Denmark). (A) pH values at different periods in rats in pPolyHb, RBC, and control groups. (B) HCO3− levels at different periods in rats in pPolyHb, RBC, and control groups. (C) Lactate levels at different periods in rats in pPolyHb, RBC, and control groups. (D) BE levels at different periods in rats in pPolyHb, RBC, and control groups.*p < .05 in comparison with baseline; #p < .05 in comparison with the control group; $p < .05 in comparison with the RBC group.
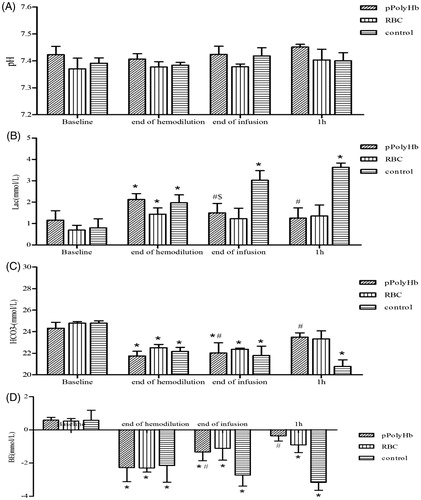
Table 1. Biochemical analysis of rat plasma obtained 7 d after infusion with pPolyHb or RBC.
Figure 3. Microscopic observations of kidney sections from rats that underwent isovolemic hemodilution and infusion with pPolyHb or RBC. The left column shows specimens taken 1 d after the procedure, and the right column shows specimens taken 7 d after the procedure (1000 × magnification).