Figures & data
Figure 1. Characterization of Silver nanoparticles synthesized from plant extract: (A) UV–Vis spectrum, (B) XRD pattern, (C) XPS analysis, (D) XPS analysis of silver metal, and (E and F) HR-TEM images.
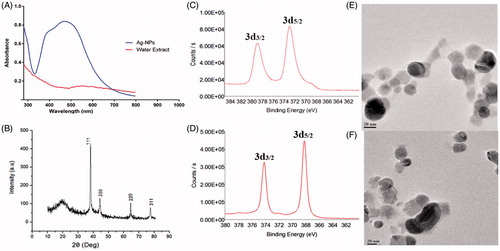
Figure 2. Characterization of gold nanoparticles synthesized from plant extract (SMAE): (A) UV–Vis spectrum, (B) XRD pattern, (C) XPS analysis, (D) XPS analysis of gold metal, and (E and F) HR-TEM images.
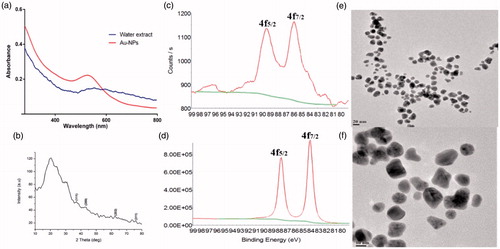
Figure 3. FTIR analysis of aqueous extract of S. maritima and its silver and gold nanoparticles.
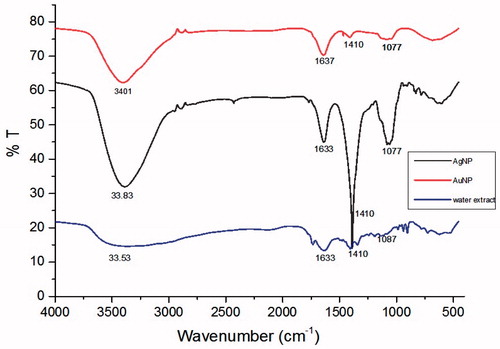
Figure 4. (A) Structure of the isolated compounds, (B) UV–Vis spectra of silver nanoparticles synthesized from isolated compounds, (C) HR-TEM image of silver nanoparticles synthesized from (I) FA: ferulic acid, (II) CA: caffeic acid, (III) SA: sinapic acid, and (IV) CHA: chlorogenic acid.
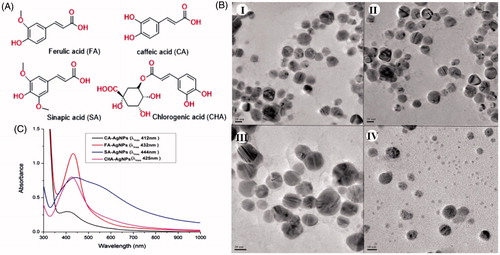
Figure 5. In vitro anti-leukemic studies of extract and nanoparticles: (a) SMAE – S. maritima aqueous extract, (b) SMAE – AgNPs, and (c) SMAE – AuNPs.
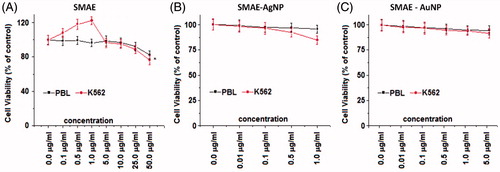
Figure 6. In vitro anti-leukemic studies of isolated compounds ferulic acid (FA), caffeic acid (CA), sinapic acid (SA), chlorogenic acid (CHA), and its AgNPs.
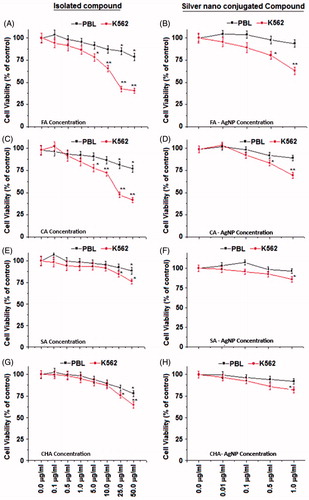
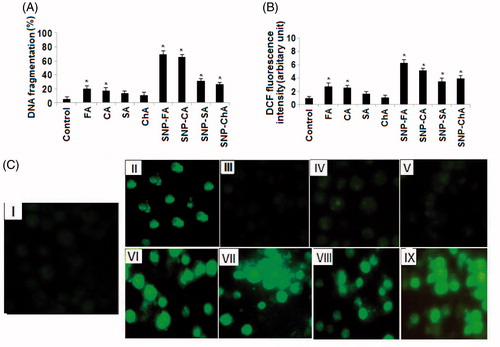
Figure 7. (A) DNA fragmentation, (B) DCF fluorescence studies, and (C) ROS generation studies of isolated compounds. (I) Control, (II–V) ROS generation by isolated compounds, (VI–X) ROS generation by silver nanoparticles of isolated compounds (SNPs).