Figures & data
Table 1. Summary of solutions and their characteristics.
Table 2 Number of animals (N) and the baseline values for heart rate (HR), mean arterial pressure (MAP), hemoglobin, hematocrit (Hct) and body weight (BW) with standard deviation according to solution used.
Figure 1. Represents the mean standard deviation for heart rate (HR) and mean arterial pressure (MAP) at 30 minutes after topload of recombinant hemoglobin (rHb) based oxygen carriers. Values are normalized to baseline at 1.0. There was statistical difference between values at 30 minutes compared with baseline. An asterisk represents statistical significance amongst different groups (G0.1WT, GProv, G3011).
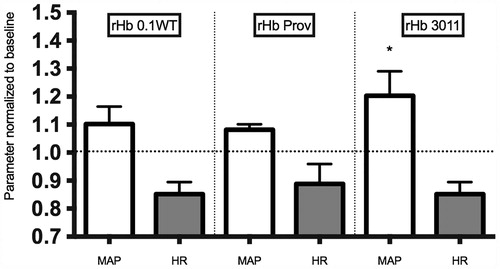
Figure 2. Represents the plasma concentration of free hemoglobin over time. An asterisk represents statistical significance (P < .05) between 30 and 90 minutes within the same solution. Two asterisks represent statistical significance amongst solutions.
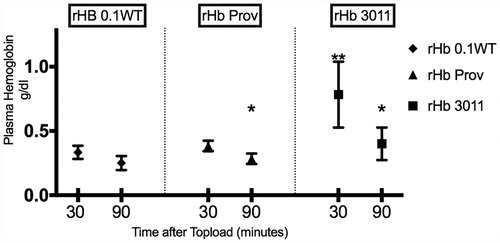
Figure 3. Individually plotted values for glomerular filtration rate (GFR) according to solution used. The shaded area denotes the range of normal GFR obtained from the control animals. Values are expressed as arbitrary units.
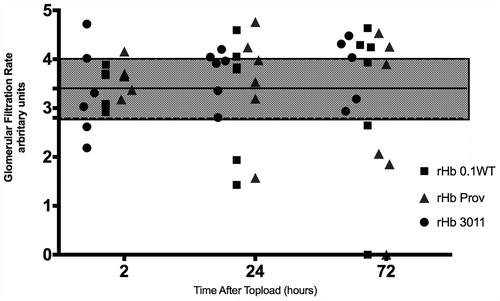
Figure 4. GFR as mean standard deviation according to solution used. The shaded area denotes the range of normal GFR obtained from the control animals. Values are expressed as arbitrary units.
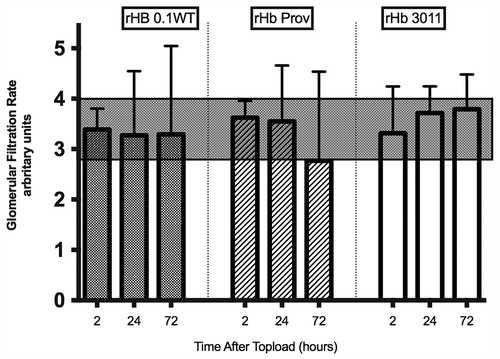
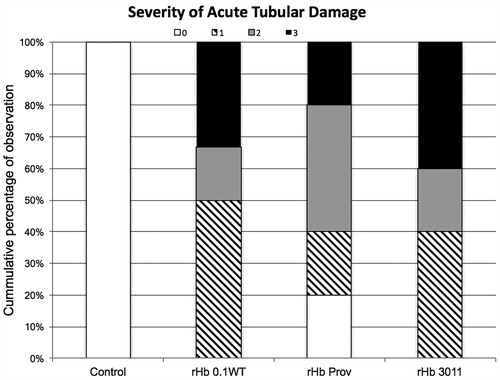
Figure 5. Severity of acute tubular damage according to solution used. Percentage on left axis according with number of animals used.