Figures & data
Figure 1. Representation of experimental setup. Hamster temperature was maintained at 37 °C. Tracheotomy allows animal mechanical ventilation and administration of anesthetic (isoflurane). Pressure–volume conductance catheter was inserted through carotid artery and advanced into the left ventricle. Femoral artery was catheterized for blood withdrawal, blood sample collection, and pressure measurements. Jugular vein was catheterized for fluid administration. Cardiac function and systemic hemodynamics measurements were using analog to digital acquisition system and stored for off-line analysis.
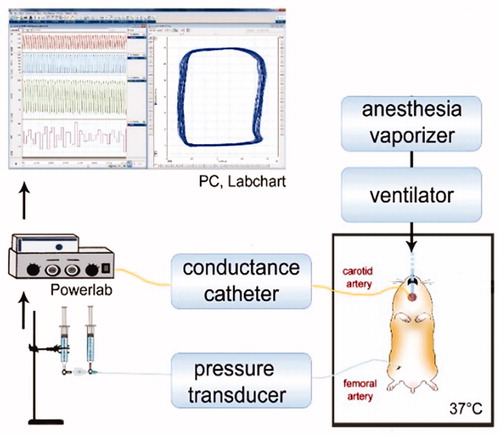
Table 1. Resuscitation fluid and blood physical properties.
Figure 2. Mean arterial pressure and heart rate during the hemorrhagic shock resuscitation protocol. †, P < .05 compared to baseline; ‡, P < .05 compared to Dextran 70; and ¶, P < .05 compared to PolyHb 8.5.
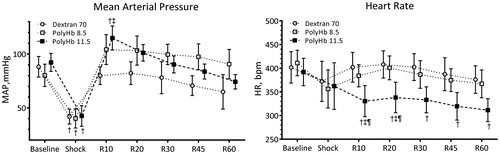
Table 2. Hematocrit, hemoglobin, and blood gases.
Figure 3. Stroke volume (SV), cardiac output (CO), systemic vascular resistance (SVR), and oxygen delivery (DO2) during the hemorrhagic shock resuscitation protocol. Estimated oxygen consumption (VO2) at baseline is presented in the DO2 panel. †, P < .05 compared to baseline; ‡, P < .05 compared to Dextran 70; and ¶, P < .05 compared to PolyHb 8.5.
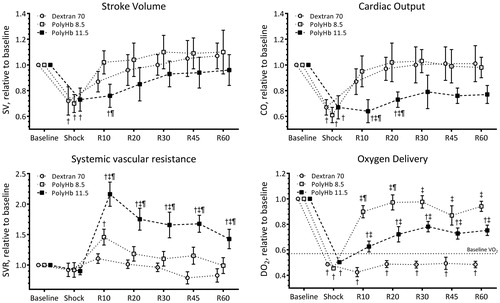
Figure 4. Indices of left ventricle cardiac function during the hemorrhagic shock resuscitation protocol. Directly measured indices of left ventricle cardiac function were end systolic pressure (Pes) and end diastolic pressure (Ped). Calculated indices of left ventricle cardiac function were ejection fraction (EF), maximum rate of pressure change (dP/dtmax), minimum rate of pressure change (dP/dtmin), and maximum filling volume rate (dV/dtmax). †, P < .05 compared to baseline; ‡, P < .05 compared to Dextran 70; and ¶, P < .05 compared to PolyHb 8.5.
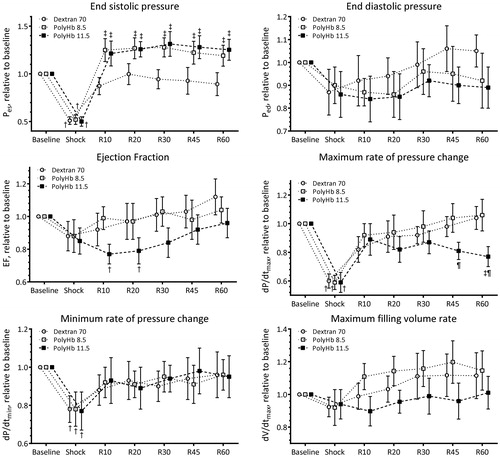
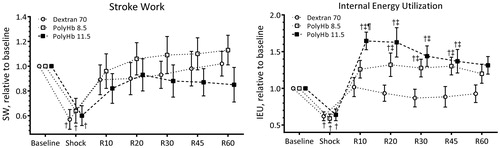
Figure 5. Energetic indices of left ventricle cardiac function during the hemorrhagic shock resuscitation protocol. Calculated external left ventricle cardiac work was estimated using stroke work, and energy metabolism utilization estimated using the internal energy utilization (Doyle et al. Citation2013). †, P < .05 compared to baseline; ‡, P < .05 compared to Dextran 70; and ¶, P < .05 compared to PolyHb 8.5.