
Figures & data
Table 1. Levels of independent and dependent variables used in experiments.
Table 2. Observed values of responses for Box–Behnken design.
Table 3. Formulation selected by point prediction for optimization.
Figure 1. (A)–(D) Three-dimensional (3D) response surface plots showing relative effects of different process parameters on the particle size and PDI.
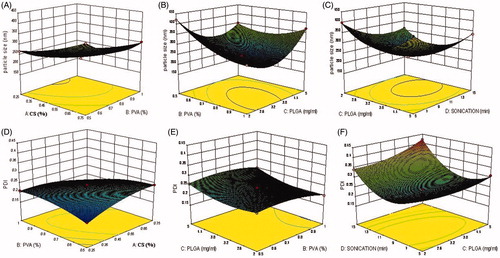
Table 4. Summary of results of regression analysis for responses R1 and R2
Table 5. Analysis of variance of calculated model for responses.
Figure 2. (A) TEM image of chitosan-coated PLGA nanoparticles. (B) Zeta potential of the optimized formulation.
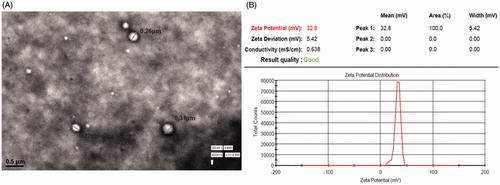
Figure 3. (A) In vitro release study of different NPs. (B) Comparison of drug release profile of CS-coated NPs, PLGA NPs, and drug solution.
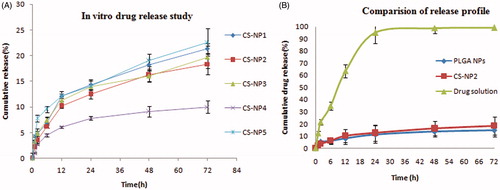
Figure 4. Ex vivo transscleral permeation of NPs and drug solution.
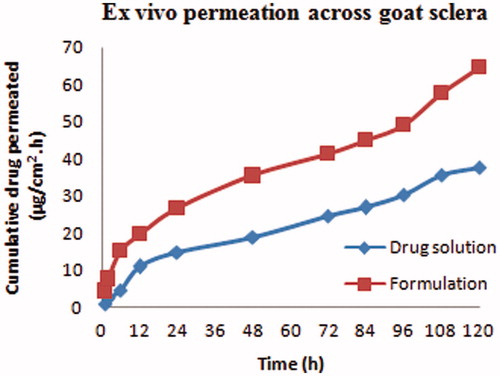
Figure 5. HET-CAM test image of formulation treated (A), negative control (B), and positive control (C).
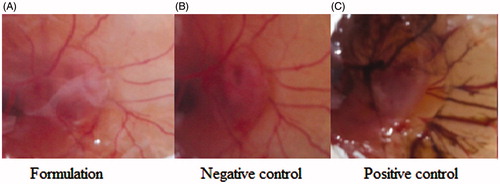
Table 6. Scores obtained in HET-CAM test.