
Figures & data
Figure 1. The structure of lansoprazole.
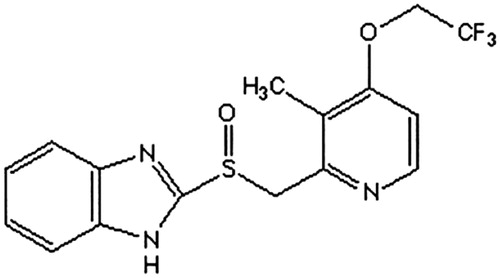
Table 1. Linearity data (line equation with a standard calibration curve) in spiked samples of blank plasma (n = 6 for each concentration level).
Figure 2. In vitro dissolution profile of lansoprazole tablets (△) and lansoprazole capsules (^) in the medium of 900 mL PBS (pH 6.8) (n = 6).
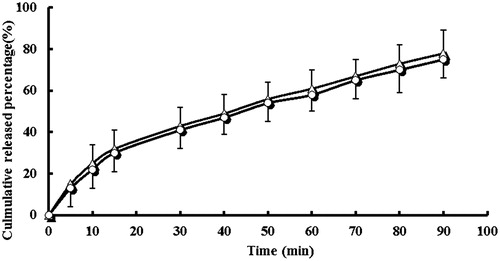
Figure 3. Mean plasma concentration curve of lansoprazole by following administration of tablets (^) and capsules (△) (n = 12, single dose: 30 mg).
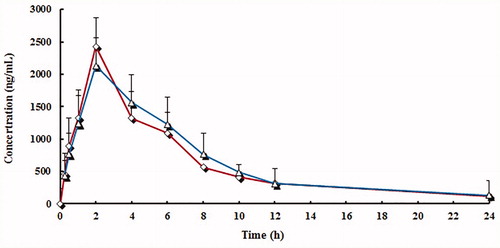
Figure 4. Mean plasma concentration curve of lansoprazole sulphone (LS) by following administration of tablets (^) and capsules (△) (n = 12, single dose: 30 mg).
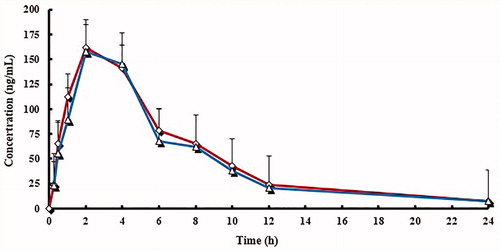
Figure 5. Mean plasma concentration curve of 5′-hydroxy lansoprazole (HL) by following administration of tablets (^) and capsules (△) (n = 12, single dose: 30 mg).
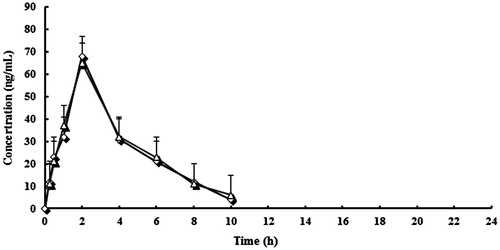
Table 2. Pharmacokinetic parameters of lansoprazole of the two formulations (n = 12, mean ± SD).
Table 3. Pharmacokinetic parameters of lansoprazole sulphone (LS) of the two formulations (n = 12, mean ± SD).
Table 4. Pharmacokinetic parameters of 5′-hydroxy lansoprazole (HL) of the two formulations (n = 12, mean ± SD).