
Figures & data
Figure 1. UV-visible absorbance spectrum of SeNPs. (A) Visible color change it indicates that synthesized selnium nanoparticle in aqueous plant extract. (B) SeNPs producing an peak at 420 nm.
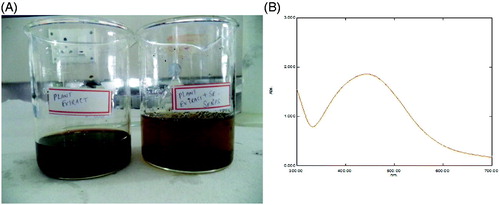
Figure 2. FT-IR spectrums of SeNPs synthesized from plant extract.
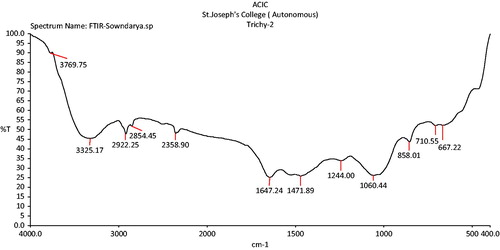
Figure 3. Energy-dispersive spectroscope of prepared selenium nanoparticles.
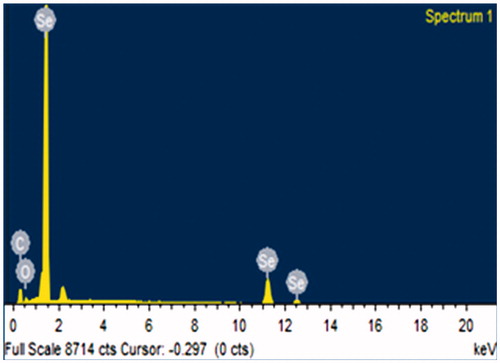
Table 1. The element analysis of the SeNPs was performed using EDX. The EDX spectrum prepared by bioreduction methods.
Figure 4. SEM micrograph of selenium nanoparticles synthesized by aqueous extracts of Clausena dentata.
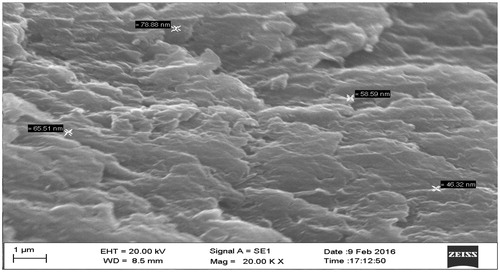
Table 2. LC50, LC90, and chi-square analysis of selenium synthesized nanoparticle from Clausena dentata leaf extract against larvicidal activity of major three mosquito vectors.