
Figures & data
Table 1. Primer sequences for qRT-PCR.
Figure 1. Synthesis route of P(NIPAAm-MAA-DMAEMAQ)&MSNs&PECGC.
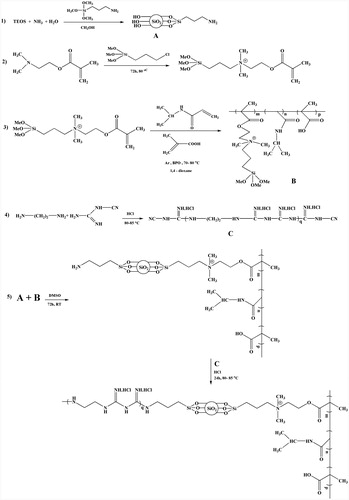
Figure 2. 1HNMR spectrum of (a) P(NIPAAm-MAA-DMAEMAQ) and (b) PECGC.
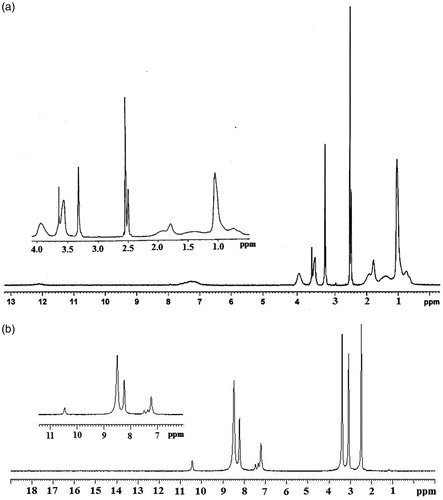
Figure 3. FTIR spectra of (a) AMSNs, (b) P(NIPAAm-MAA-DMAEMAQ), (c) PECGC, and (d) P(NIPAAm-MAA-DMAEMAQ)&MSNs&PECGC.
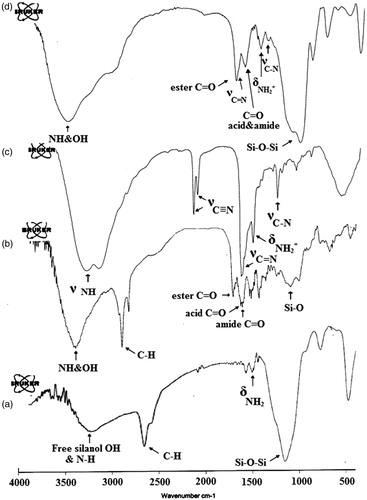
Figure 4. (a) SEM images of P(NIPAAm-MAA-DMAEMAQ)&MSNs&PECGC, (b) selected area EDX analysis for P(NIPAAm-MAA-DMAEMAQ)&MSNs&PECGC, and (c)TGA thermogram of P(NIPAAm-MAA-DMAEMAQ)&MSNs&PECGC nanoparticles.
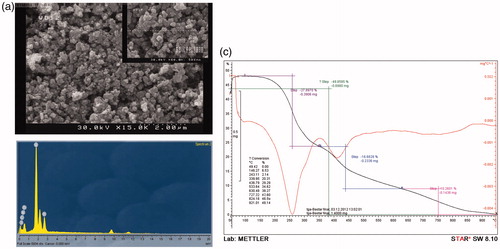
Figure 5. (a) Scheme of simultaneous loading of multiple anticancer drugs including doxorubicin (DOX) and methotrexate (MTX) on pH-responsive P(NIPAAm-MAA-DMAEMAQ)&MSNs&PECGC nanoparticles and (b) cumulative release of methotrexate (MTX) and doxorubicin (DOX) from DOX@MTX loaded pH-responsive P(NIPAAm-MAA-DMAEMAQ)&MSNs&PECGC nanoparticles at different pH (4, 5.8, and 7.4) 37 °C.
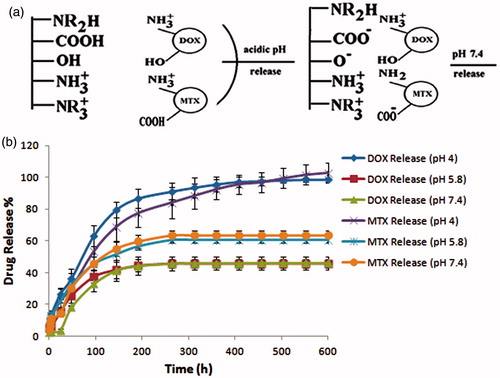
Figure 6. (a) Streak cultures on the surfaces of Mueller–Hinton agar plates, the first concentration with no sign of bacterial growth on plates considered as minimum inhibitory concentration (MIC), (b) cell growth inhibition rates by different concentration of MTX@DOX@Carrier and MTX@DOX on MCF7 cell lines after 72 h incubation, (c) cell viability of blank P(NIPAAm-MAA-DMAEMAQ)&MSNs&PECGC nanoparticles on adipose tissue derived mesenchymal stem cells after 72 h, and (d) the expression levels of cyclin D1 in each treatment of the MCF-7 cells were studied using qRT-PCR. GAPDH served as internal control. The cyclin D1 was down regulated after drug/polymer treatments, the expression levels were obviously smaller in lower doses of drug/polymer. *P < 0.05, **P < 0.01, and ***P < 0.001.
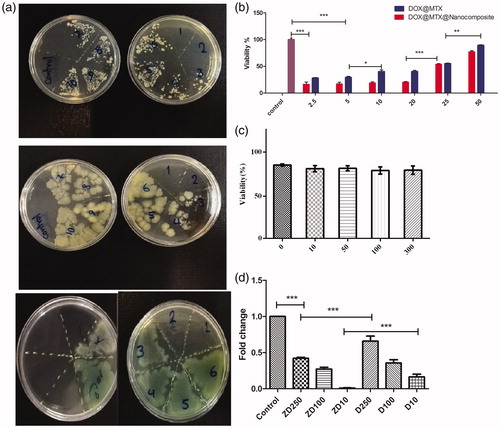
Table 2. Results of minimum inhibitory concentration (MIC) determination (mg.mL−1).