Figures & data
Figure 1. The role of actinobacterial metabolites as reducing agent in biosynthesis of ZnO nanostructures.
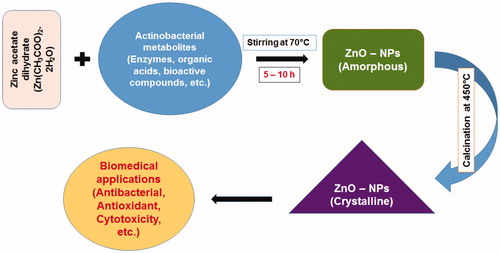
Figure 2. Phylogenetic tree of potent Streptomyces sp. (MA30) based on 16S rRNA sequence analyzed by Bootstrap method.
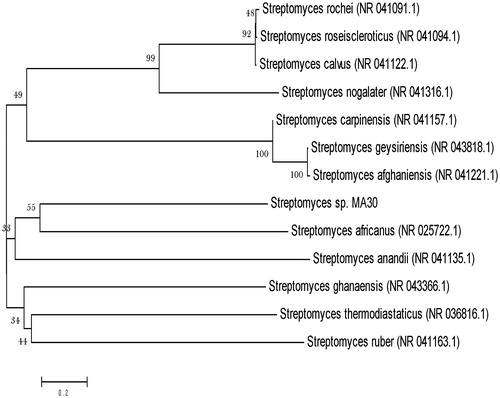
Figure 3. (A) FT-IR spectrum of the ZnO-NPs, (B) characterization of the ZnO-NPs by XRD analysis, and (C) EDX observation of ZnO-NPs.
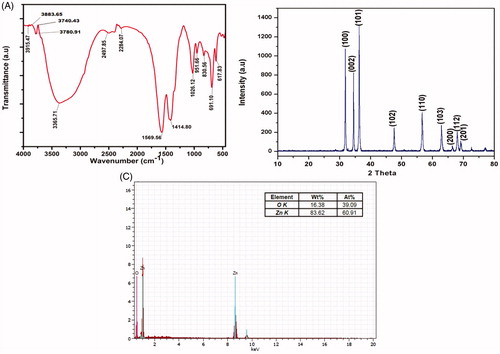
Figure 4. Morphology of synthesized ZnO-NPs (A – SEM image, B – 2D and 3D topography images of AFM, C – HR-TEM image, D – SAED pattern, and E – DLS spectrum).
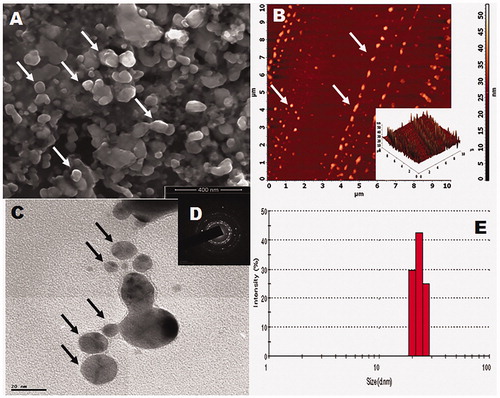
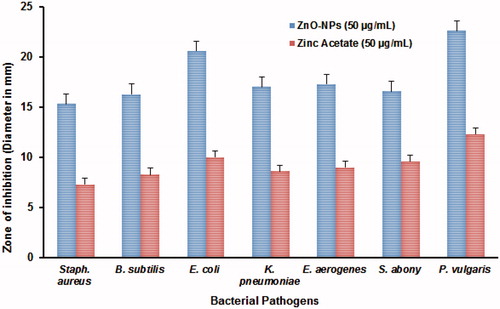
Table 1. Antibacterial activity of biosynthesized ZnO-NPs by agar well diffusion method. The results are presented as mean ± (SD) (n = 3).
Figure 6. Antioxidant activity of actinobacterially synthesized ZnO-NPs. (A) DPPH radical scavenging activity and (B) nitric oxide free radical scavenging activity.
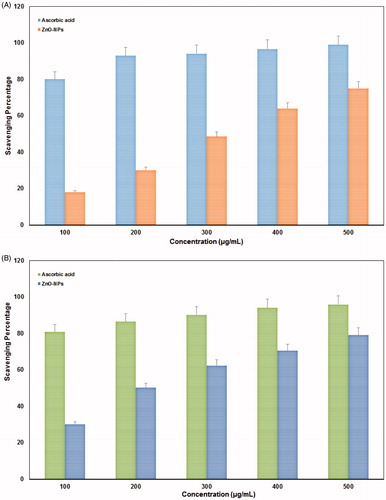
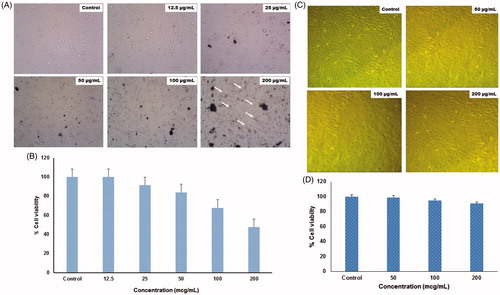
Figure 7. Cytotoxicity test of ZnO-NPs against MG63 (A, B) and Vero (C, D) cell lines at various concentrations.