
Figures & data
Figure 1. High-resolution transmission electron microscopic analysis of NPs.

Table 1. Particle size, zeta potential, and encapsulation efficiency of NPs are shown. Data represented as mean ± SD (n = 5).
Figure 2. In vitro release from the NPs, % cumulative GEM release versus time in PBS (pH 7.4) and PBS (pH 5.8). The data represent the mean ± SD (n = 6).
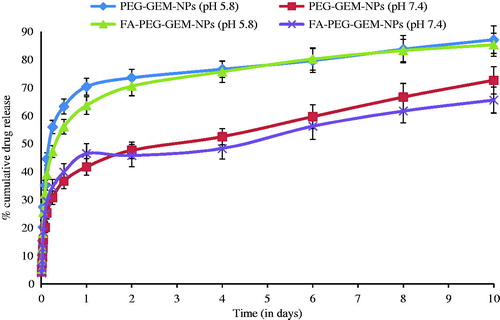
Figure 3. Graph showing % fluorescent cells after 3 h incubation with PEG-FITC-NPs and FA-PEG-FITC-NPs. The data represent mean ± SD (n = 6).
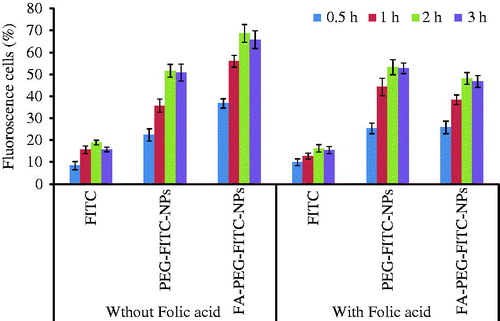
Figure 4. The fluorescence microscopy photomicrographs showing uptake of dye (FITC)-loaded NPs (FITC-NPs) in A549 cell line. The FITC-labeled FA-PEG-FITC-FANPs showed greater uptake in comparison with free FITC, PEG-FITC-NPs.
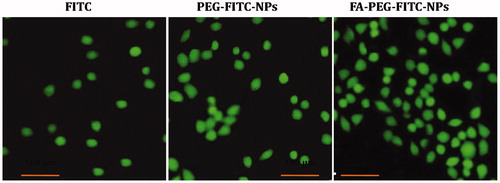
Figure 5. The toxicity of different concentrations of plain GEM, PEG-GEM-NPs, and FA-PEG-GEM-NPs was determined when these formulations were incubated with A549 cell for 48 h. The data represent mean ± SD (n = 6) different formulations.
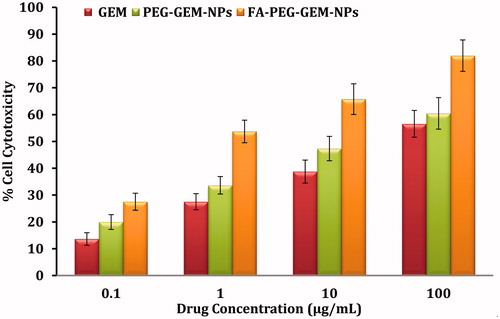
Figure 6. Plasma profiles of free drug, PEG-GEM-NPs, and FA-PEG-GEM-NPs at different time intervals. The data represent mean ± SD (n = 3).
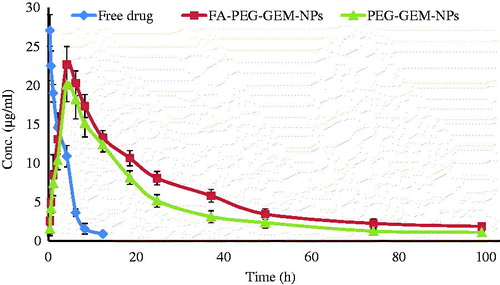
Table 2. Pharmacokinetic parameters in serum of Balb/c mice time. The data represented as mean ± SD (n = 3).
Figure 7. The bio-distribution of free GEM, GEM-loaded onto PEG-GEM-NPs, and FA-PEG-GEM-NPs in different deep-seated tissues at different time intervals. The data represent mean ± SD (n = 3).
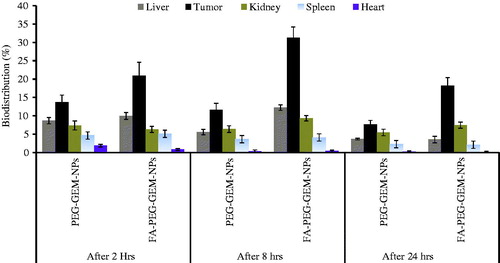
Figure 8. Assessment of anti-tumor activity in tumor-bearing animal model by the estimation of tumor burden. The anti-tumor activity of free GEM, PEG-GEM-NPs, and FA-PEG-GEM-NPs on days, 3, 7, and 11. The data represent mean ± SD (n = 3).
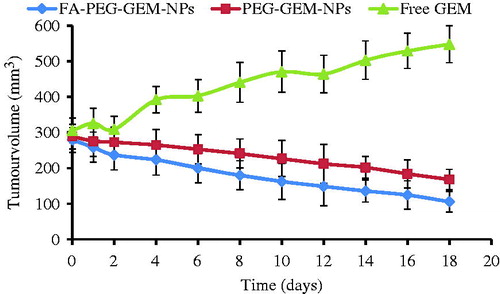
Table 3. The toxicity profile of plane GEM, PEG-GEM-NPs, and FA-PEG-GEM-NPs. The data represented as mean ± SD (n = 3).