Figures & data
Figure 1. Unfolding spectra in the Soret region of reduced, HbCO, and oxidized, metHb, forms of OxyVita®Hbs in presence of increasing concentrations of urea at T = 37 °C, pH 7.35.
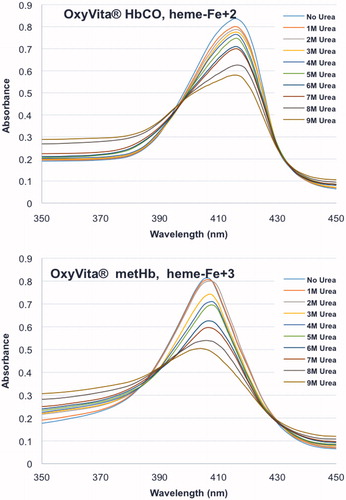
Figure 2. Size Exclusion Chromatograms (SEC) of OxyVita®C HbCO (top) and OxyVita®metHb (bottom). Wavelength detection was at 280 nm. Column used was 60 cm long ×0.5 cm diameter with Fractogel (20–40 μm) with a flow rate of 0.5 mL/min. Mobile phase was 0.05M phosphate buffer at pH =7.4.
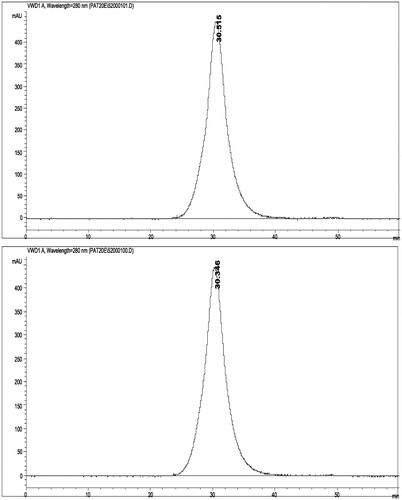
Figure 3. Unfolding spectra in the Soret region of the met forms of myoglobin (monomeric), bovine Hb (tetrameric), and OxyVita®Hb (zero-linked polymeric) in the presence of urea at T = 37 °C, pH 7.35.
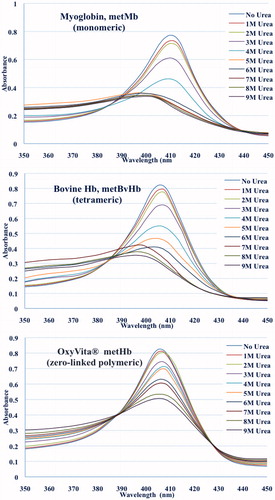
Figure 4. Unfolding transitions in the Soret wavelength maximum of the oxidized met forms of Mb, BvHb, OxyVita®Hb, and the reduced (CO) form of OxyVita®Hb in the presence of increasing concentrations of urea at T = 37 °C, pH 7.35.
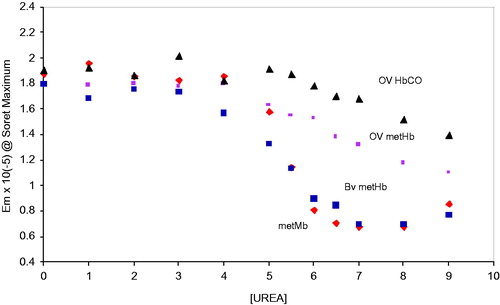
Figure 5. Comparison of the changes in the Soret wavelength maximum for the met forms of Mb, BvHb, and OxyVita®Hb in the presence of increasing concentrations of urea at T = 37 °C, pH 7.35.
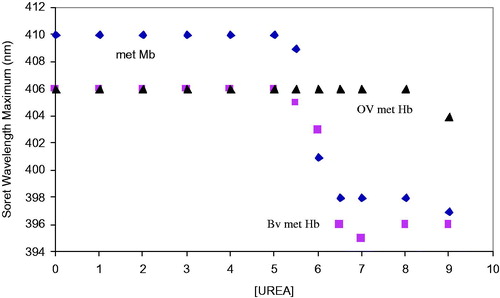
Table 1. Denaturation midpoint (D1/2) at T = 37 °C in presence of urea.
Figure 6. Changes in the Soret wavelength maximum for the reduced forms (CO and Oxy) and oxidized form of OxyVita®Hbs in the presence of increasing concentrations of urea at T = 37 °C, pH 7.35.
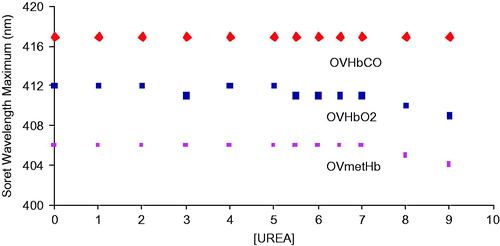
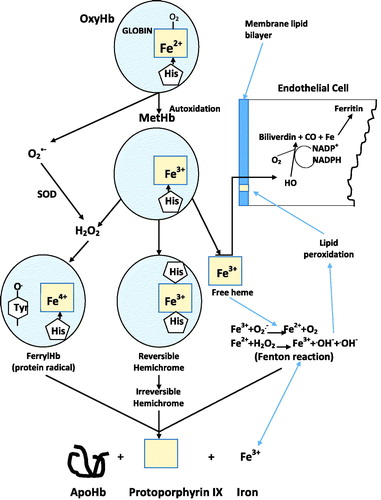
Figure 7. Oxidative pathways associated with heme exposure.