Figures & data
Figure 1. Study protocol for isolated Langendorff heart perfusion groups. Hearts were subjected to an initial equilibration period of 20 min (when pre-ischemic function was measured), arrested with a 2-min infusion (at 4–8 °C) of the cardioplegic solution prior to 8 h of cold (4–8 °C) storage in Celsior supplemented (treated group, n = 12) or not (control group, n = 12) with 1 g/L of HEMO2life® (M101) and then reperfused for 60 min with warm (37 °C) Krebs–Henseleit bicarbonate buffer. Recovery of function (expressed as a % of pre-ischemic function) was assessed throughout reperfusion.
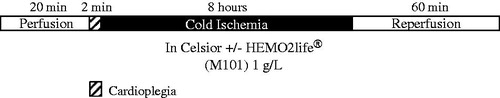
Figure 2. Recovery of LVDP (% pre-ischemic function) over 60 min reperfusion with warm (37 °C) Krebs–Henseleit bicarbonate buffer in C and C + M101 groups. *P < 0.0001 versus Celsior.
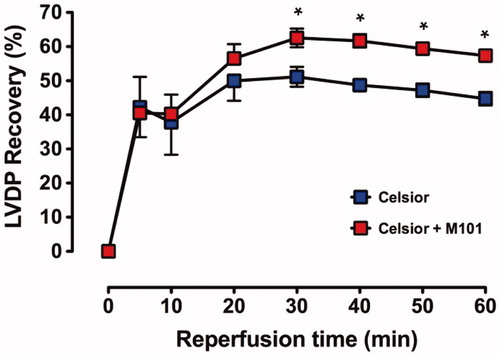
Table 1. Celsior versus Celsior + M101: baseline data for each function parameter (LVDP, LVEDP, HR and CF), and recovery data during 60 min of reperfusion.
Figure 3. Recovery of CF in C and C + M101 groups. CF was measured from t = 20 min. *P < 0.02 versus Celsior.
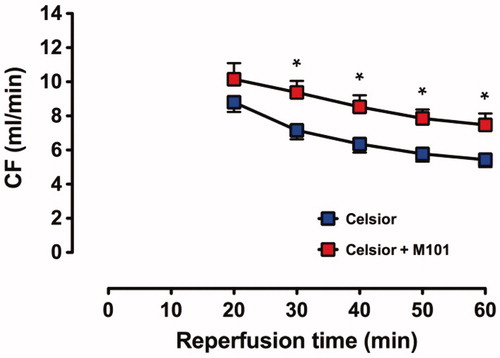
Figure 4. Recovery of (A) LVEDP and (B) HR for C and C + M101.
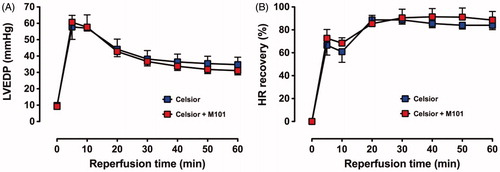
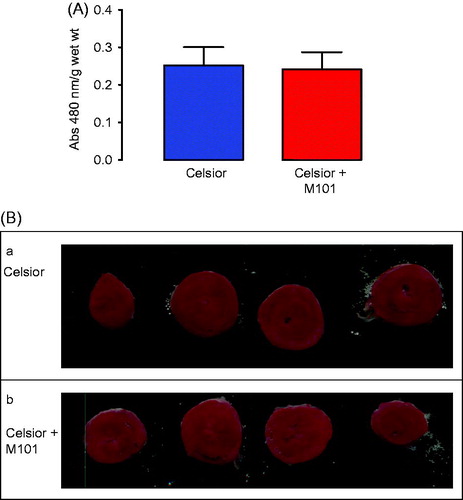
Figure 5. Myocardial viability (TTC staining) for C and C + M101 (A) and Representative transverse heart sections (2 mm) from C (a), C + M101 hearts (b), stained with TTC at the end of the isolated heart perfusion protocol. Very patchy areas of pale yellow in the myocardium are visible, representing non-viable tissues (B).