Figures & data
Figure 1. Experiment procedure and treatment schedule. CI: cannula implantation; ICV-STZ: intracerebroventricular streptozotocin; ORT: object recognition task; MWM: Morris water maze.
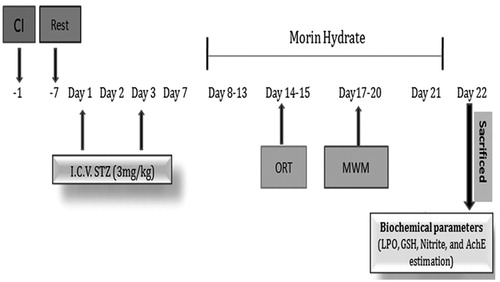
Table 1. Solubility of morin hydrate in oils, surfactants and co-surfactants.
Figure 2. Pseudoternary phase diagram with varying ratios of the investigated quaternary system water/Cremophor EL/PEG-400/Capmul MCM with (a) Smix in the ratio of 5:5, (b) Smix in the ratio of 6:4, (c) Smix in the ratio of 9:1, (d) Smix in the ratio of 7:3, and (e) Smix in the ratio of 8:2. The shaded areas indicate the clear w/o microemulsion system. The phase study revealed that the maximum emulsification region was found to be 7:3 surfactant/co-surfactant ratio.
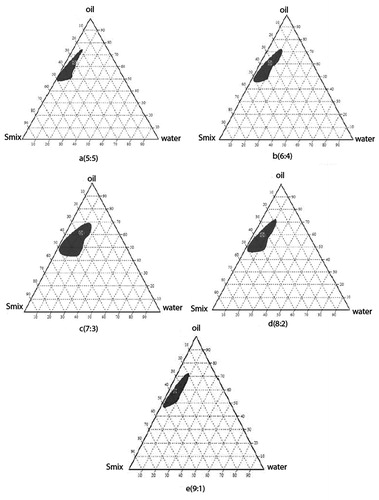
Table 2. Composition of optimized blank microemulsion.
Table 3. Physicochemical properties of morin hydrate-loaded microemulsion.
Figure 3. Size and size distribution images of optimized morin hydrate loaded microemulsion. Globule size and polydispersity index of optimized (F2) formulation were found to be 227.5 and 0.323 nm, respectively.
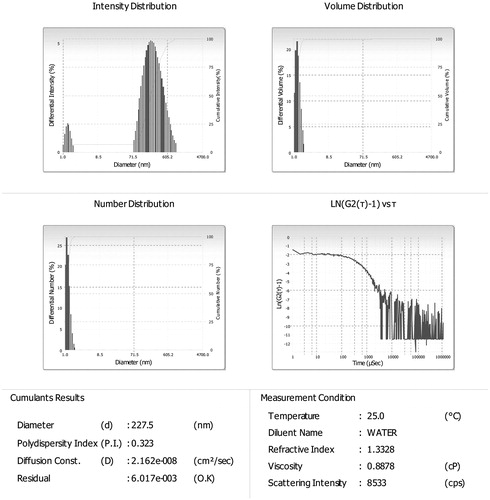
Figure 4. Zeta potential of optimized morin hydrate loaded microemulsion. Zeta potential of optimized morin loaded microemulsion (F2) was found to be (−10.61 mV).
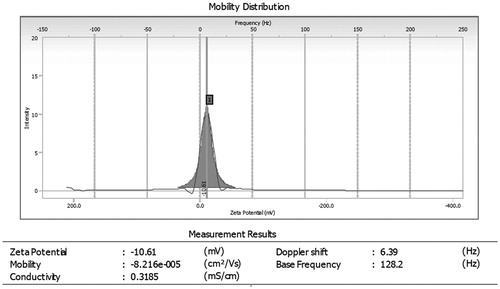
Figure 5. Percentage in vitro release profile of morin hydrate loaded microemulsion. Each point represents mean ± SD (n = 3). The release profile of formulation (F2) showing 94.05% release in 240 min.
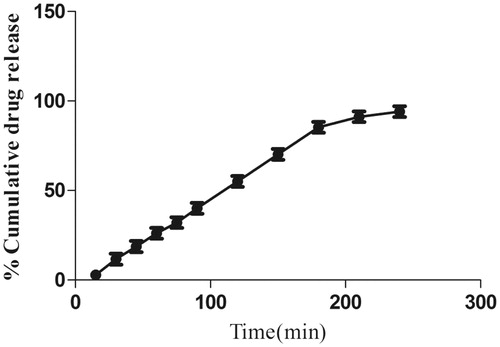
Table 4. Physical stability studies of morin loaded microemulsion.
Figure 6. Effect of morin hydrate on memory performance in object recognition test in ICV-STZ infused rats (a) acquisition phase, trail-1 and (b) retention phase, trail-2. Values are expressed as aP < 0.05 versus sham control, bP < 0.05 versus STZ-; cP < 0.05 versus STZ + morin hydrate.
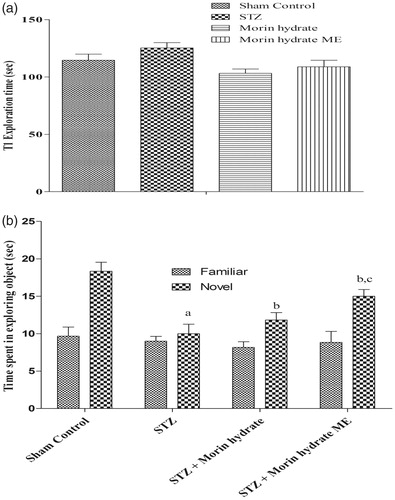
Figure 7. Effect of morin hydrate loaded microemulsion (ME) on mean latency in Morris water maze (MWM) task in ICV-STZ infused rats. aP < 0.05 versus sham control; bP < 0.05 versus STZ; cP < 0.05 versus STZ + morin hydrate.
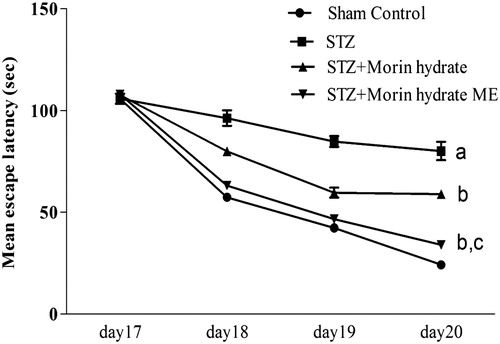
Table 5. Various parameters of oxidative stress.
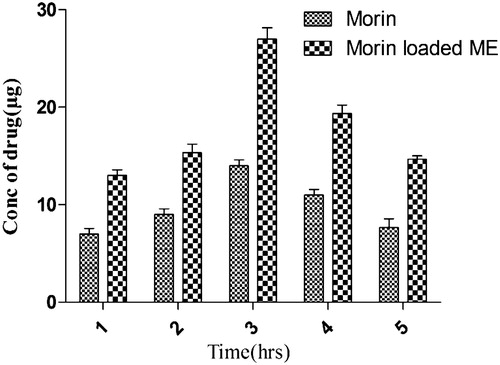
Table 6. Concentration of drug reaching the blood at different time intervals.
Figure 8. Overlay chromatogram of morin hydrate in plasma.
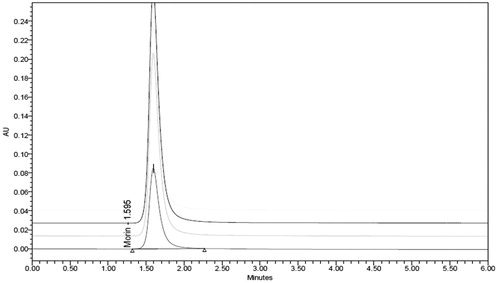
Figure 9. Standard curve of morin hydrate in plasma.
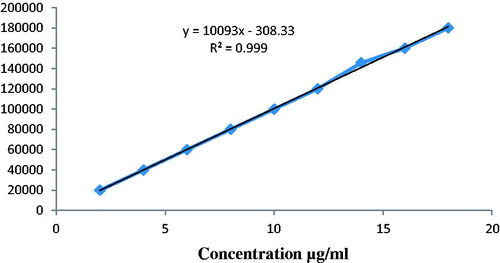
Figure 10. Concentration of morin hydrate in brain versus time for plain morin hydrate (IN) and morin hydrate loaded microemulsion (IN).