Figures & data
Table 1. hTERT mRNA level in Real-time PCR measurement.
Figure 1. Scanning electron microscopy of (A) Fe3O4 magnetic nanoparticles, and (B) silibinin-loaded Fe3O4 magnetic nanoparticles modified with PLGA-PEG copolymers.
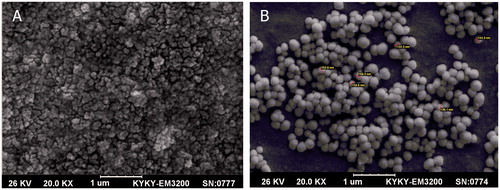
Figure 2. FTIR plot of (A) PLGA-PEG copolymer nanoparticles, (B) pure Fe3O4 nanoparticles and (C) loading silibinin in nanoparticle PLGA-PEG-Fe3O4.
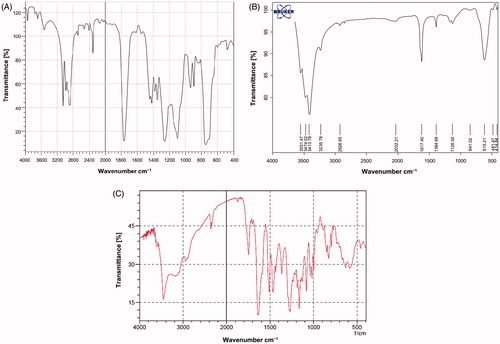
Figure 3. 1HNMR of PLGA-PEG copolymer.
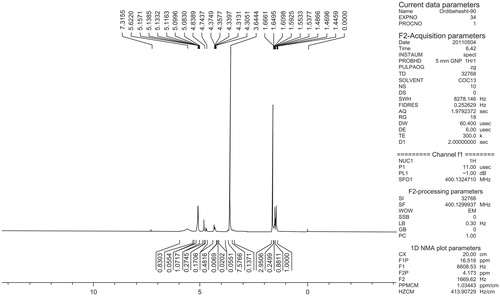
Figure 4. Magnetic hysteresis curve. (A) Magnetic hysteresis curve of pure Fe3O4 nanoparticles and (B) magnetic hysteresis curve of silibinin-loaded PLGA-PEG-Fe3O4 nanoparticles.
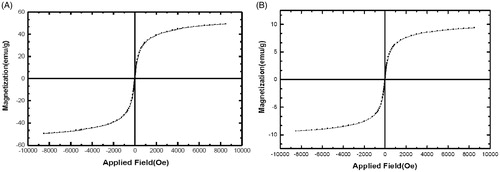
Figure 5. Cytotoxic effect of different concentrations of silibinin on A549 lung cancer cell line during 24 (A), 48 (B), and 72(C) h.
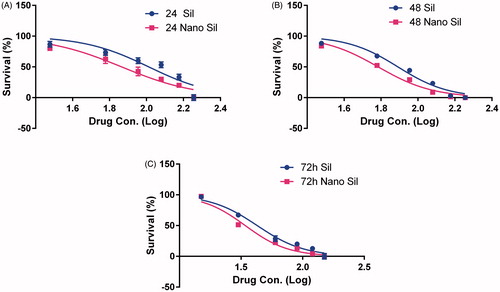
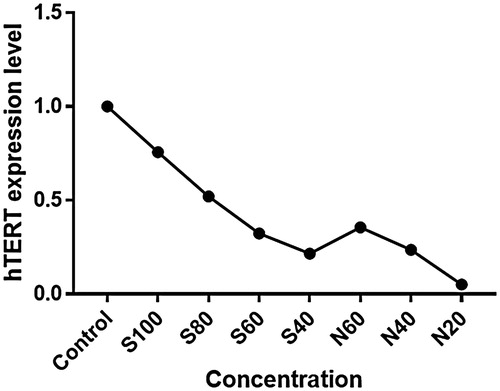
Figure 6. Result of hTERT gene expression study by real-time PCR. Effect of different concentrations of pure silibinin and silibinin-loaded PLGA-PEG-Fe3O4 nanoparticles on the levels of hTERT genes expressions in A549 lung cancer cell line.