Figures & data
Table 1. Independent variables and response for three-factor, two-level full factorial statistical experimental design.
Table 2. Characteristics of PLGA230 and PLGA160 nanoparticles.
Figure 1. Size and dye release properties of PLGA230 and PLGA160 nanoparticles. (A) Average particle size of Dil-labelled PLGA nanoparticles as a function of the polymer concentration. (B) Release of Dil from PLGA230 and PLGA160 nanoparticles into 0.5% (w/v) SDS containing PBS. AFM (C) and TEM (D) images of PLGA230 nanoparticles and PLGA160 nanoparticles.
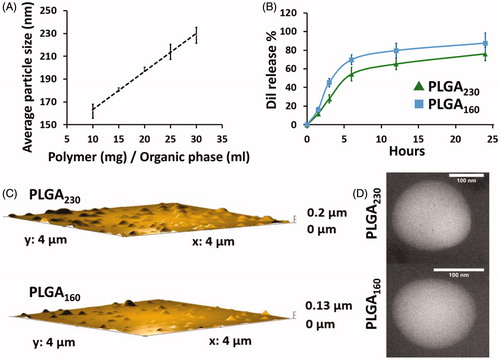
Figure 2. Effect of different-sized PLGA nanoparticle counts (nanoparticle number/ml) on cell viability and cellular uptake. (A) Cytotoxicity of PLGA230 and PLGA160 nanoparticles incubated at different nanoparticles counts with HEK293 cells. Cytotoxicity was determined using DRAQ7 viability dye. Percentage of viable cells is shown. (B) Typical DRAQ7 viability assay flow cytometry contour plots for cells treated with 5 × 10¹⁰/ml PLGA230 and PLGA160 nanoparticles. Purple (or gray) contours represent dead cells that are labelled with DRAQ7 (FSC, forward scatter). (C) Percentage of Dil+ cells that engulfed nanoparticles at the end of 24 h incubation time. (D) Change in the fluorescence intensity at various time points showing uptake kinetics of Dil-labeled PLGA230 and PLGA160 nanoparticles applied at counts number of 1.25 × 10¹⁰/ml. (E) Fluorescence microscopy images of PLGA230 and PLGA160 nanoparticles incubated with cells at same numbers of nanoparticles/ml (1.25 × 10¹⁰/ml). The cell nuclei were stained with DAPI. The Dil-loaded nanoparticles can be observed as inclusion bodies. (F) The fluorescence microscope images of the cells treated with same weight of PLGA230 and PLGA160 nanoparticles (G) The uptake efficiency of nanoparticles when the fluorescence intensity was normalized to the amount of dye encapsulated (i.e. weight of the nanoparticles) into the nanoparticles (1.25 × 10¹⁰/ml, 24 h incubation). (*p < 0.05).
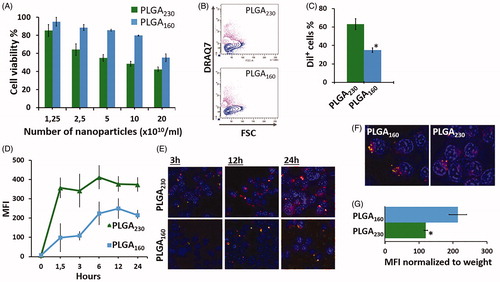
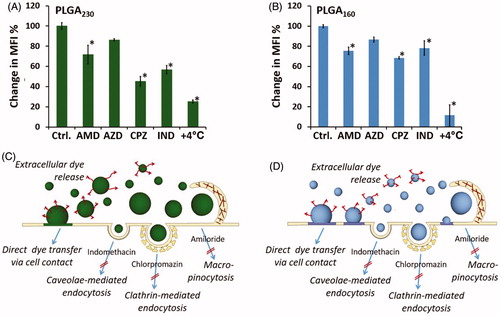
Figure 3. Evaluation of endocytic pathways employed in cell uptake of PLGA230 (A and B) and PLGA160 (C and D) nanoparticles. The cells were pre-treated with different endocytosis inhibitors (as shown in B and D) and the same numbers of Dil-labeled nanoparticles were applied onto the cells. The percentage change in median fluorescence intensity values were calculated in comparison to the control cells that were not treated with inhibitors. Schematic representation of possible intracellular drug delivery mechanisms of PLGA230 (B) and PLGA160 (D) nanoparticles are summarized.