
Figures & data
Figure 1. Chemical synthesis of poly(N-vinylcaprolactam)-COOH.
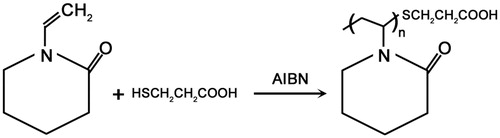
Figure 2. ATR-FTIR spectra of (A) NVCL and PNVCL-COOH and (B) collagen and PNVL-g-Col.
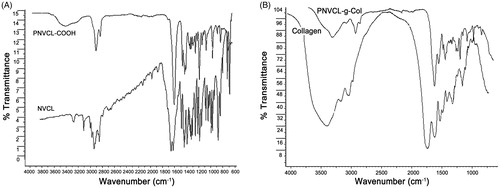
Figure 3. 1H NMR spectra of (A) NVCL and (B) PNVCL-COOH.
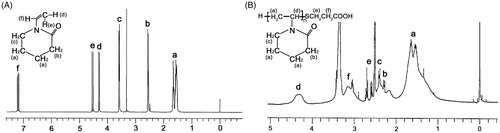
Figure 4. Molecular weight distribution of PNVCL-COOH. Arrow indicates zone of interest.
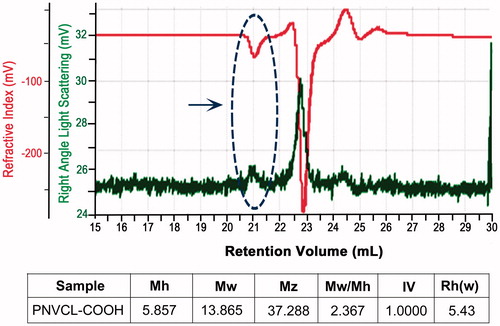
Figure 5. Synthesis of poly(N-vinylcaprolactam)-g-collagen.
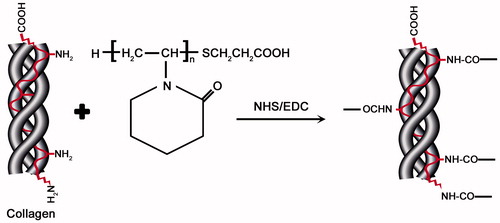
Figure 6. Temperature dependent phase change of PNVCL, collagen, and PNVCL-g-Col. Inset photo showing PNVCL-g-Col hydrogel before (transparent fluid at 4 °C) and after gelation (white opaque gel at 40 °C).
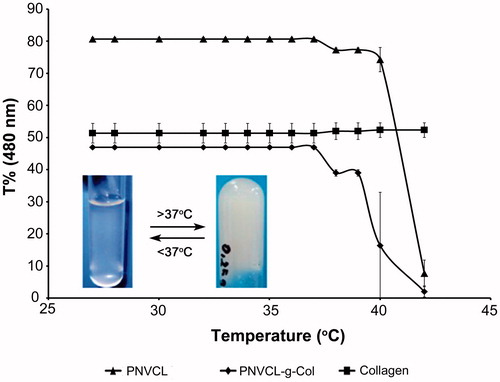
Figure 7. Repetitive phase transition experiment of PNVCL-g-Col performed between 25 °C (below LCST) and 40 °C (above LCST) for 12 cycles. Sol-to-gel and gel-to-sol transition takes ∼1.5–2 min at each cycle.
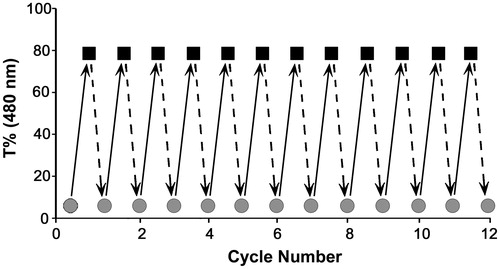
Figure 8. DSC thermograms of (A) PNVCL and (B) PNVCL-g-Col.
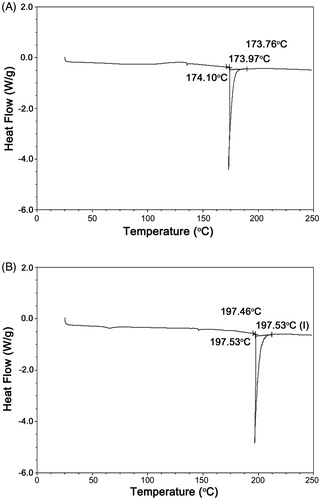
Figure 9. TGA curves of (A) PNVCL, (B) collagen, and (C) PNVCL-g-Col.
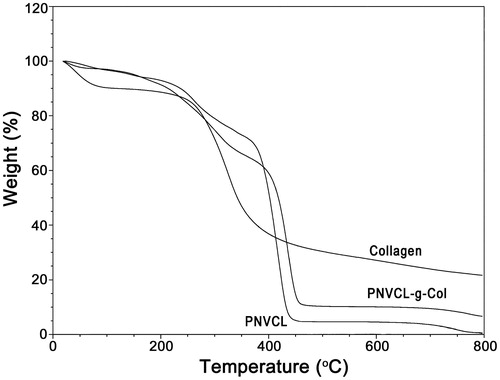
Figure 10. Rheological assessments during phase transition, as a function of stress, time, temperature, and strain sweep. G′ is the stored elastic modulus and G″ is the viscous loss modulus.
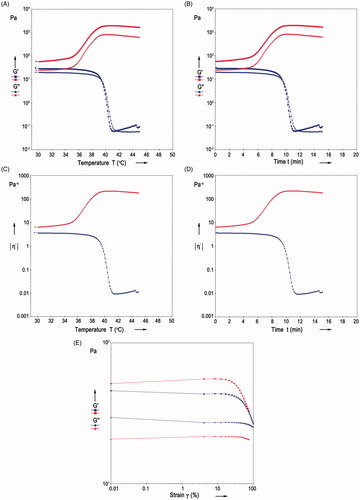
Figure 11. Water uptake of PNVCL-g-Col depending on temperature at (A) 4 °C (below the LCST) and (B) 40 °C (above the LCST).
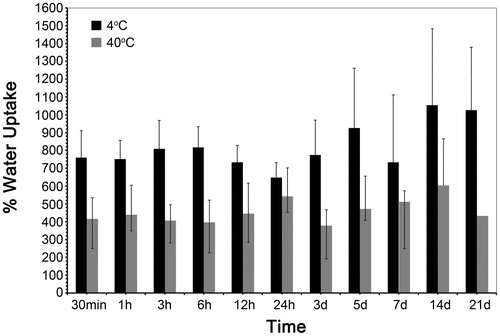
Figure 12. Cumulative release profile of (A) BSA and (B) lidocaine hydrochloride from PNVCL-g-Col at 4 °C and 40 °C. Mean ± standard deviation from three independent experiments in triplicates.
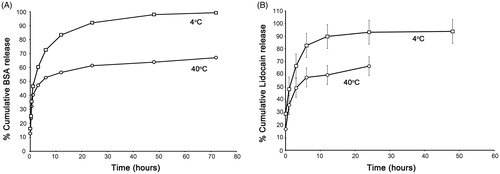
Table 1. In vitro cytotoxicity evaluation based on indirect extract testing (ISO 10993-5).