
Figures & data
Figure 1. Particle size of the nanoplexes (with different polymers or polymer conjugates) prepared in 150 mM saline at polymer to plasmid DNA weight ratio of 10:1.
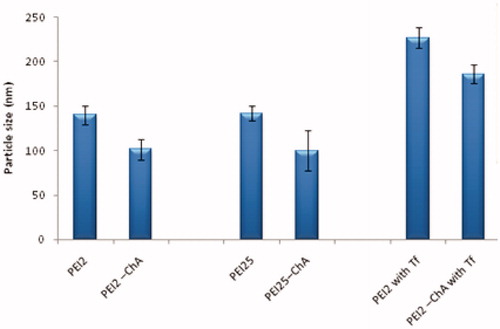
Figure 2. Zeta potential of the nanoplexes prepared with different polymers or polymer conjugates prepared in 150 mM saline at polymer to plasmid DNA weight ratio of 10.
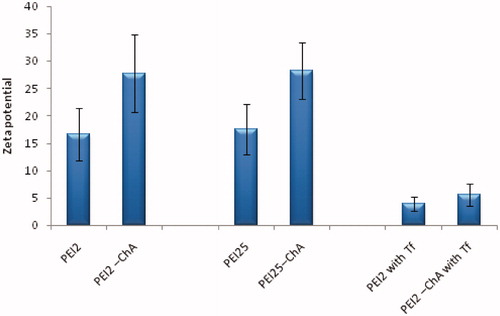
Table 1. Treatment groups of nanoplexes with corresponding mean %GFP positive cells after normalization in U87MG cells.
Figure 3. The % GFP positive U87MG cells (after normalization) corresponding to different treatment groups.
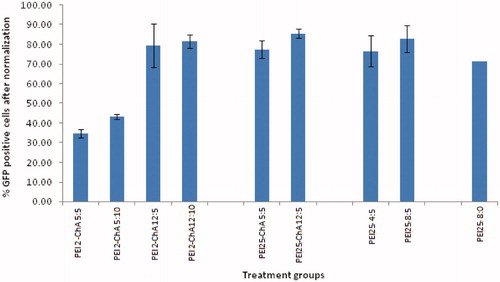
Figure 4. Flow cytogram showing GFP positive and negative cells (shift from gated region) corresponding to different treatment groups with and without transferrin.
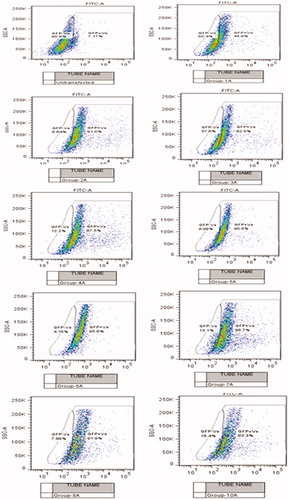
Figure 5. GFP expression for nanoplexes prepared in 150 mM saline with polymer to plasmid weight ratio of 10 (B) and 12 (C) in NT8e cells after 48 h by fluorescence microscopy; (A) is cells treated only with 150 mM saline.
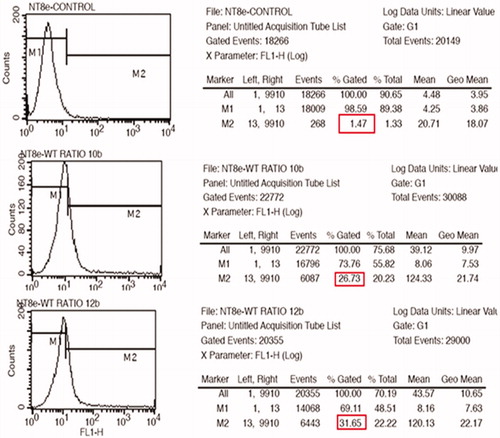
Figure 6. GFP expression for nanoplexes prepared in 150 mM saline with polymer to plasmid weight ratio of 10 (A) and 12 (B) in NT8e cells after 48 h by fluorescence microscopy; (A) is cells treated only with 150 mM saline.
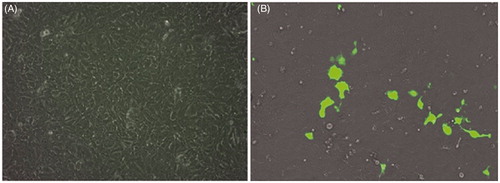
Figure 7. Mean fluorescence intensity of FL1 + cells for treatment groups with nanoplexes with “no incubation” after preparation and “24 h incubation” after preparation (incubation at 37 °C).
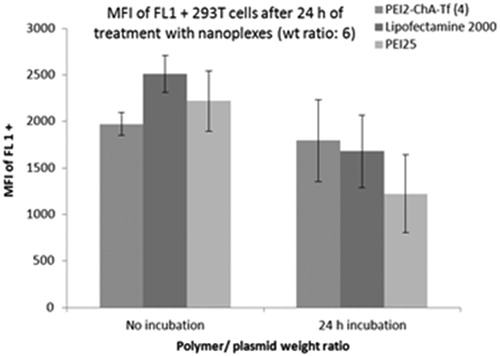
Figure 8. BMP-2 production in hBMSC cells using the nanoplexes prepared with PEI2-ChA and PEI25. The no treatment group was used as a control (with 150 mM saline) and the plasmid BMP-2 group was used as negative control.
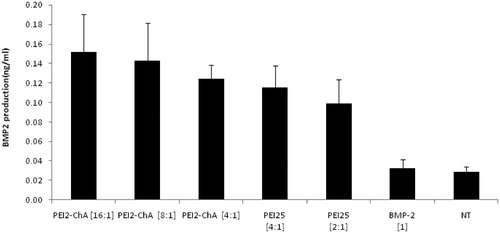
Figure 9. Cell-cycle analysis in NT8e cells showing cell population corresponding to G0-G1 (A), G2-M (B), and S phases (C).
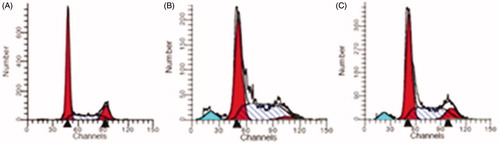
Figure 10. p53 expression by Western blot analysis using anti-mouse primary antibody p53 in NT8e cells (lane 1: negative control; lane 2: naked plasmid p53; lane 3:positive control; lane 4:PEI25:pDNA conjugate at weught ratio 8:1; lane 5: PEI25:pDNA conjugate at weught ratio 10:1).
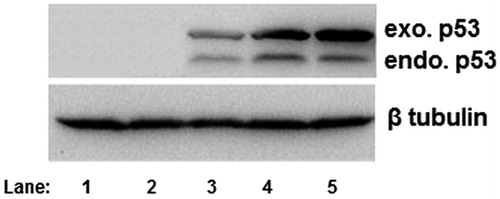
Figure 11. In vivo imaging of mice treated with nanoplexes of PEI2-ChA without transferrin (A, B, and C) and with transferrin (D, E, and F). Control mice (G) were treated only with 150 mM saline. H and I are images for organs isolated from animals treated with and without transferring, respectively.
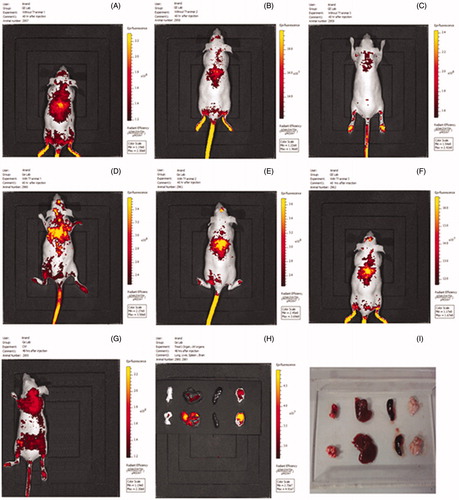
Figure 12. Treatment with wild-type plasmid p53 induces regression of ectopic solid tumors. Pictures showing tumor volume of untreated/control mice (B) and mice treated with transferring-containing nanoplexes of PEI2-ChA with plasmid p53 (A). The numbers in the pictures denotes in-house animal numbers for identification and are unique for each animal.
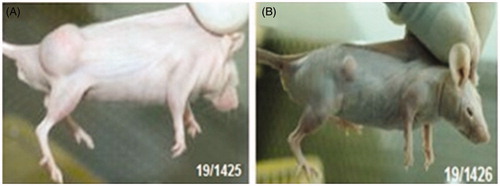
Figure 13. Tumor size of two groups (termed as control and treated) after tumor induction (A) and after treatment (B); tumor volume expressed in cm3.
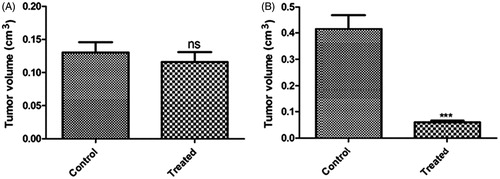
Table 2. Tumor size of control group at tumor induction and post-tumor induction (cm3).
Table 3. Tumor size of treated group before and after treatment (cm3).