Figures & data
Table 1. Primers of BMP-2 gene from Shanghai Genechem Co. Ltd. and amplified by PCR.
Table 2. Gene primers of BMP-2 and GAPADH were devised for related mRNA expression, while ALP, OC, OPN and RUNX2 were designed for analyzing osteogenic differentiation using qPCR.
Figure 1. Rat bone mesenchymal stem cells (BMSCs) in culture (passage 5) were transfected with Lv-BMP2-EGFP-Puro (A) at a multiplicity of infection (MOI) of 10 or (B) MOI = 30 and (C) MOI = 50. Cellular transfection efficiency was evaluated by the fraction of GFP fluorescent using fluorescent microscopy at 72 h subsequent to the transduction.
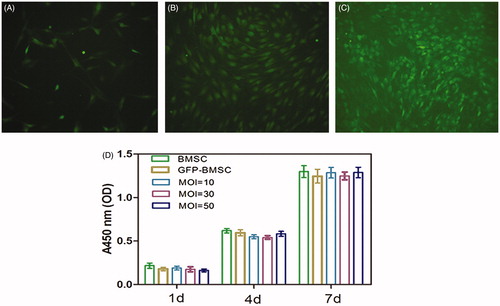
Figure 2. (A) Measurement of BMP2 mRNA expression of each group (control and BMP2) by RT-PCR at 7 d and 14 d after transduction. The result revealed that BMP2 gene modified BMSCs highly expression at each time point (mean ± SD, n = 5 for each group). (B) Expression of bone morphogenetic protein 2 (BMP2) in Western blot analysis.
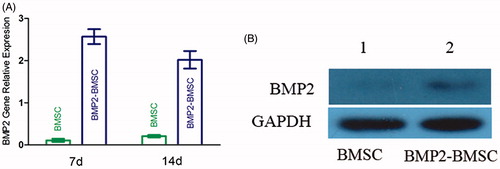
Figure 3. (A) Fresh microcapsules released from the outlet; the morphology was round with consistent sizes. (B) Photomicrographs of transduced BMP-2 gene BMSCs encapsulated in the CMC-Ph microparticles of average 100–150 μm in diameter (Nikon Eclipse Ti-U, Japan). (C) Different diameters of CMC-Ph microcapsules with different rates of liquid paraffin (CMC-Ph solution at a consistent speed of 60 μL/min). Error bars show the standard deviation of randomly selected 60 microparticles.
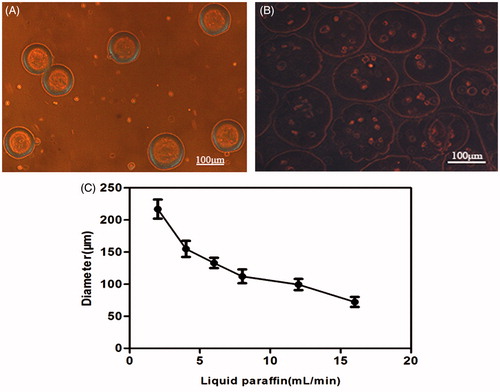
Table 3. Viability of encapsulated BMP-2 gene-modified BMSCs at different time points. Data were illustrated as mean ± SD (n = 5). Statistical analyzed via one-way ANOVA.
Figure 4. Live/dead viability kit for enclosed BMP-2 gene-modified BMSCs after cultured 24 h and 21 d. (A) Green fluorescence represents live cells. (B) Red fluorescence noted the dead cells.
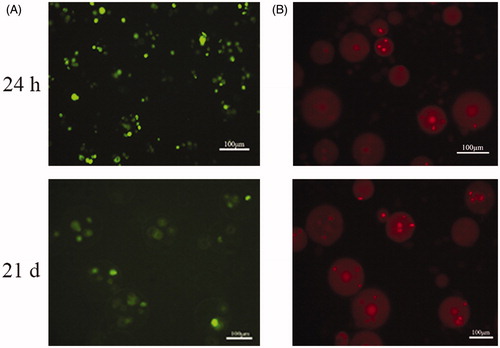
Figure 5. (A) Micrograph of BMP-2 gene-mediated BMSCs enclosed in CMC-Ph microcapsules after 12 d cultured. Cell proliferation was observed in microcapsules. (B) Variability in the mitochondrial activity of enclosed cells per microcapsule. Error bars denote the standard deviation of three independent experiments.
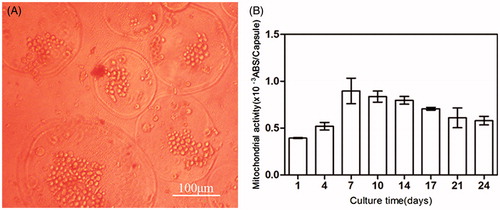
Figure 6. (A) Comparison of microcapsules encompassing BMP-2 gene-modified BMSCs with cells alone (without microcapsules). The highest induction scale of Tet-mediated BMP-2 production was measured on the 14 d and any significant difference between the two groups was not observed at each time point (p > 0.05). (B) BMP-2 expression on microcapsules enclosed gene-transduced or normal BMSCs by induction of 1 μg/mL doxycycline from days 1 to 5. The significant differences were measured on each day in the gene modified BMSCs compared with the untreated cells (p < 0.001) but decreased to the basal level when stop using doxycycline. (C) Upon withdraw of doxycycline, the BMP-2 expression declined to background level on day 35. Without addition of doxycycline, BMP-2 secretion was negligible. All results were presented as mean ± SD, standardized to the values for 1 × 10⁶ microcapsules.
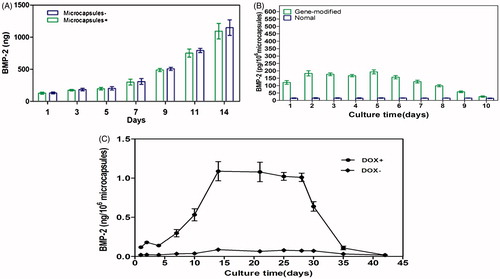
Figure 7. Osteogenic gene expression measurement of BMP2–BMSCs encapsulated in CMC-Ph microcapsules. (A) ALP, (B) OC, (C) OPN, and (D) RUNX2 gene relative expressions were increased in each group illustrating that encapsulated BMP2–BMSCs differentiated into the osteogenic lineage. Bars with distrinct letters exhibit significantly different from each other (p < 0.05). Data were show as mean ± SD (n = 5).
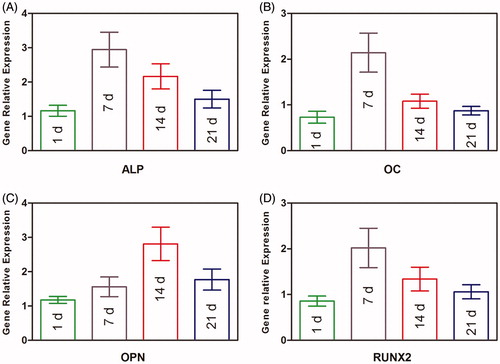
Figure 8. (A) Detection of ALP activity. The ALP activity in BMP2–BMSCs was higher than BMSCs (data analyzed using two-way ANOVA, p < 0.05) (mean ± SD, n = 5 for each group). (B) ALP staining was more intense in the BMP2–BMSCs group compared with the BMSCs group.
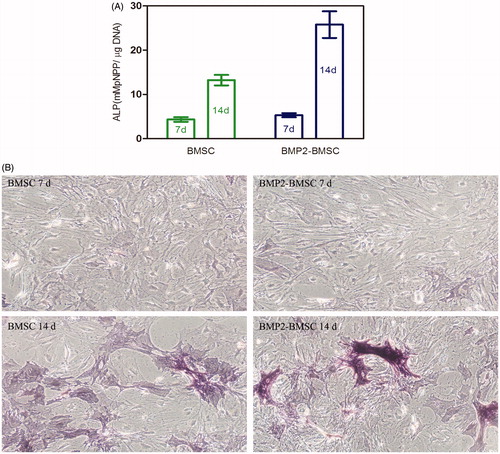
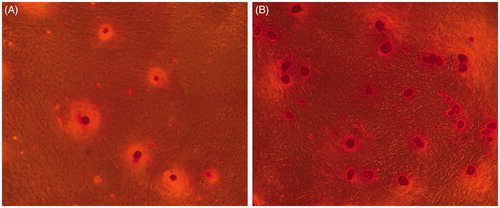
Figure 9. Alizarin Red S staining. (A) Normal BMSCs. (B) Compared with BMSCs, significant osteogenic nodule was synthesized by BMP2–BMSCs.