
Figures & data
Table 1. Molecular characterics of the synthesized copolymers.
Figure 1. (a) AFM image of SF-loaded spherical core shell micelles; (b) particle size distribution; (c) zeta potential.
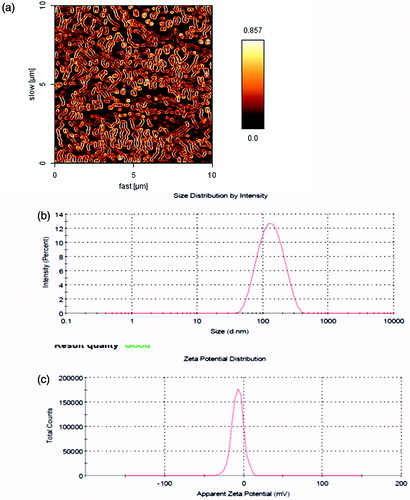
Table 2. Properties of SF-loaded PCL–PEG–PCL micelles.
Table 3. Characterisistic of micelles from the synthesized copolymers.
Figure 2. (a) The release profiles of SF from SF-PCL–PEG–PCL micelles in different release media. (b) The release profiles of SF from SF-PCL–PEG–PCL micelles in different copolymers composition.
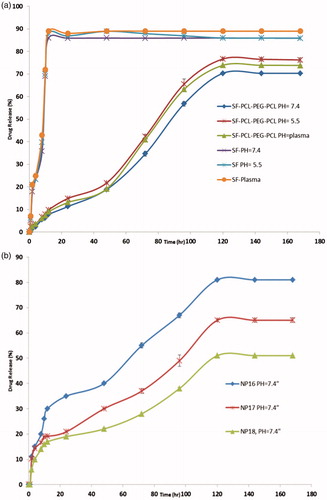
Figure 3. Cytotoxicity of free SF, PCL–PEG–PCL micelles and SF-loaded micelle against MCF-7, MCF10A and 4T1 cells. The cells were incubated with SF-loaded micelle (SF concentration 1–30 μmol/L) for 48 and 72 h at 37° C each bar represents the mean of five measurements ± SD.
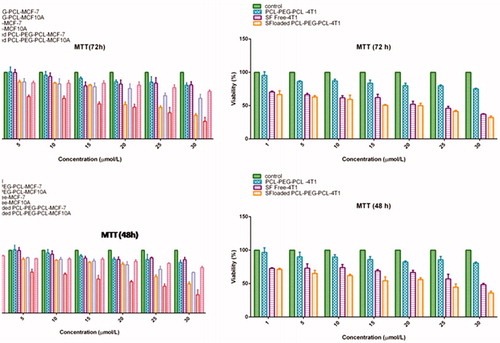
Figure 4. (a) Statistical analysis of flow cytometry results show total apoptosis and live cell percentages in 4T1 cells. The values represent mean ± SD. *P < 0.0001, #P < 0.0001, and +P < 0.0001 indicate significant difference between PCL–PEG–PCL, free SF, and SF/PCL–PEG–PCL, respectively. (b) The apoptosis induction by SF at [PCL–PEG–PCL] micelles (D), free SF (C), [PCL–PEG–PCL] Micelles (B) and negative control (PBS) (A) on 4T1 cell line.
![Figure 4. (a) Statistical analysis of flow cytometry results show total apoptosis and live cell percentages in 4T1 cells. The values represent mean ± SD. *P < 0.0001, #P < 0.0001, and +P < 0.0001 indicate significant difference between PCL–PEG–PCL, free SF, and SF/PCL–PEG–PCL, respectively. (b) The apoptosis induction by SF at [PCL–PEG–PCL] micelles (D), free SF (C), [PCL–PEG–PCL] Micelles (B) and negative control (PBS) (A) on 4T1 cell line.](/cms/asset/3e6f942a-f34f-48fb-ac08-56dc50f99baf/ianb_a_1282501_f0004_b.jpg)
Figure 5. (a) Statistic analysis of gene expression in MCF-7 cells after 48 h treatments with 20 μmol/L of free SF, PCL–PEG–PCL micelles and SF loaded PCL–PEG–PCL. Each experiment was repeated three times. (b) Effects of PCL–PEG–PCL micelle and SF-loaded PCL–PEG–PCL micelle on the level of nitric oxide in NR8383 cells. Data represents the mean ± standard error of The mean of four experiments (P < 0.01 is significantly different from the LPS); (c) Hemolytic test on PCL–PEG–PCL micelle and SF-loaded PCL–PEG–PCL micelle. Data represent the mean ± standard error of the mean of three experiments (P < 0.01 compared to saline group); (d) Antitumor effect of free SF, PCL–PEG–PCL micelles and SF-loaded PCL–PEG–PCL in 4T1 tumor bearing mice. Mice were administered free SF (•) and SF-loaded micelle (▪) andPBS (▴) i.v at the equivalent 30 mg/kg SF.
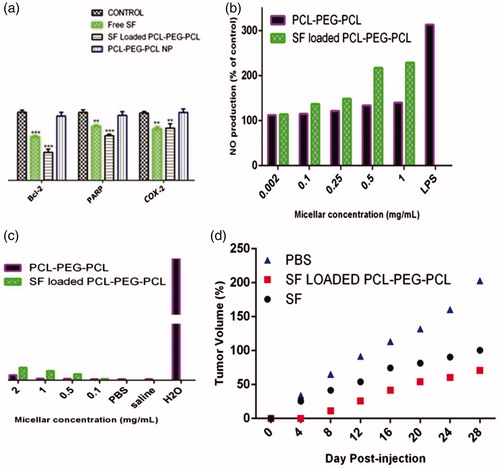
Figure 6. Comparison of in vivo plasma concentration vs. time profiles of the different SF formulations. All values reported are the mean ± SD (n = 5).
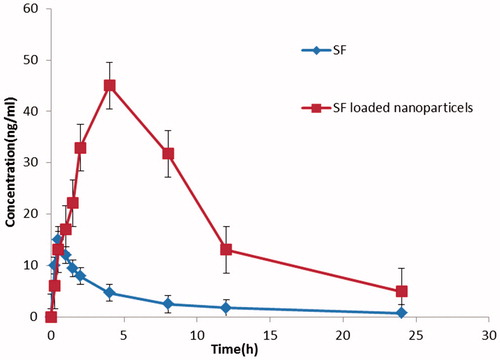
Table 4. Pharmacokinetic parameters of SF following single oral administration of SF aqueous solution and SF-loaded micelles, in rats (n = 5).