Figures & data
Figure 1. Physical properties of LPS loaded chitosan nanoparticles. SEM image of chitosan nanoparticles shows that the particles had the same size and spheroid shape (A). Zetasizer showed that the size of chitosan NP mostly ranges from 150 to 200 nm (B).
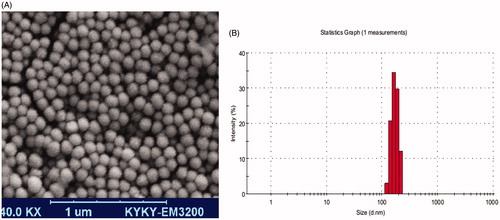
Figure 2. Release profiles of LPS from LPS–chitosan–NPs at pH 7.4 at 37 °C for 96 h, calculated as a cumulative percent.
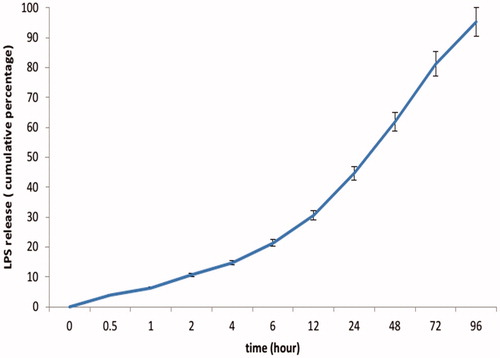
Figure 3. Serum titration of immunized mice with LPS–Freund and LPS–chitosan nanoparticle. Titration of sera total antibody (A) and titration of sera IgA (B) showed a significant difference between two groups (P < .001).
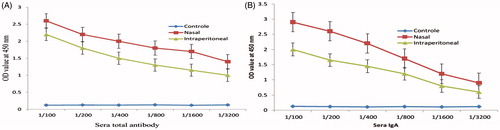
Figure 4. Serum IgG (A) and IgM (B) titration of immunized mice with LPS–Freund and LPS–chitosan nanoparticle only showed a significant difference of IgG level between two groups (P < .001).
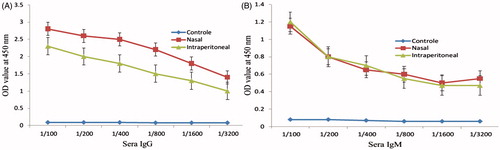
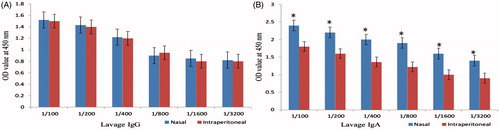
Figure 5. Lavage fluid IgG (A) and IgA (B) titration of immunized mice with LPS–Freund and LPS–chitosan nanoparticle showed that lavage IgA level has a significant difference between two types of administration roots (P < .001).