Figures & data
Table 1. Physicochemical characterization of blank, dox-loaded and MAb-targeted dox-loaded nanoparticles.
Figure 1. Microscopic images of MAb-conjugated NLC and FITC-labelled secondary antibody. The green dots indicate the nanoparticles coated with MAb (A). Unconjugated NLC incubated with FITC-second antibody used as control sample (B).
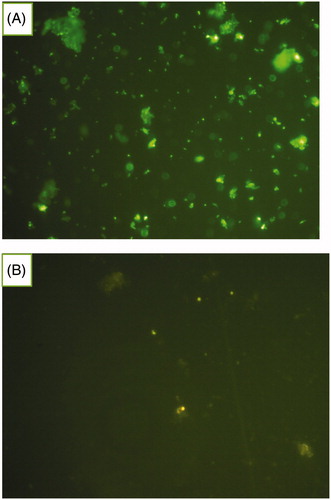
Figure 2. Dox release profiles from Dox-NLC (•) and Ab-Dox-NLC (^) in PBS (pH 7.4, 37 °C) analyzed by dialysis bag method. This profile indicated a slow and prolonged release pattern that only ∼30% of Dox was released during 160 h (n = 3, mean ± standard deviation).
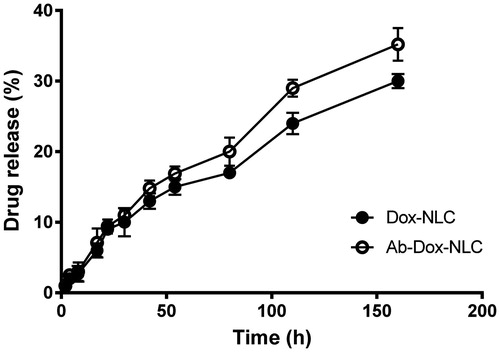
Figure 3. Cell viability of (A) HC2 20d2/c and (B) NIH-3T3 cells incubated with free Dox, blank NLC, Dox-NLC and MAb-Dox-NLC. The assay was carried out in 96-well microtiter plates. Cells were seeded at definite density and incubated for 24 h. Then, the cells were treated with various concentrations of Dox, NLC, Dox-NLC and MAb-Dox-NLC. Cytotoxicity was determined using MTT assay. Data are presented as mean ± standard deviation (n = 8).
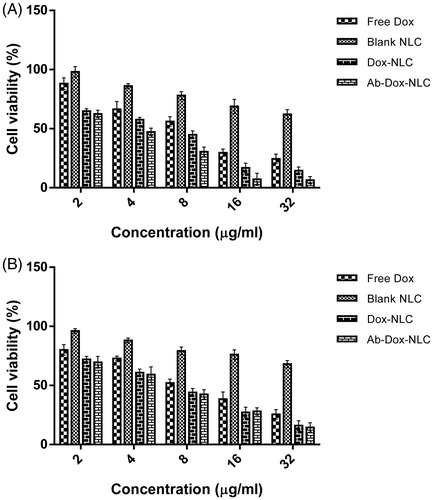
Table 2. Inhibitory concentration of dox producing 50% of cell inhibition (IC50) in HC2 20d2/c and NIH-3T3 cells.
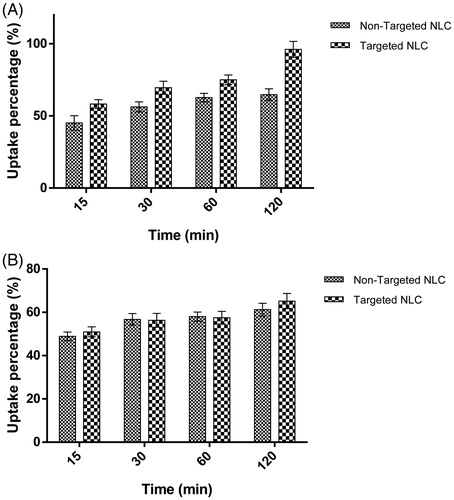
Figure 4. Cellular uptake percentage of targeted and non-targeted NLC against incubation time in (A) HC2 20d2/c and (B) NIH-3T3 cell lines. Dox-NLC and MAb-Dox-NLC were incubated with HC2 20d2/c and NIH-3T3 cells for 15, 30, 60 and 120 min at 37 °C. After the cells had been lysed, the fluorescence intensity of Dox in both of formulations was determined. Data are presented as percentages of Dox detected in the cell lysate (n = 2, mean ± standard deviation).