Figures & data
Figure 1. UV-Vis spectra of (a) FA-AuNps, (b) FA-AgNps and (c) aqueous plant extracts. Insets show the colour conversion of reaction mixtures into FA-AuNps (purple) and FA-AgNps (brown).
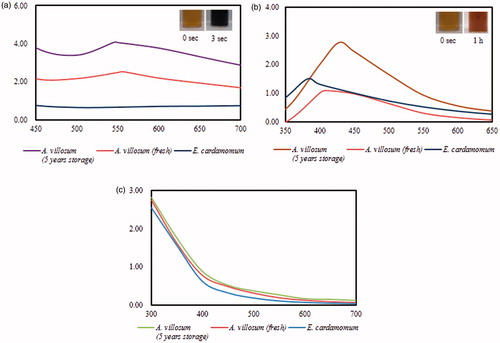
Figure 2. TEM images of spherical (a, b, and c) FA-AuNps and (e, f, and g) FA-AgNps. Elemental mapping of (d) gold and (h) silver.
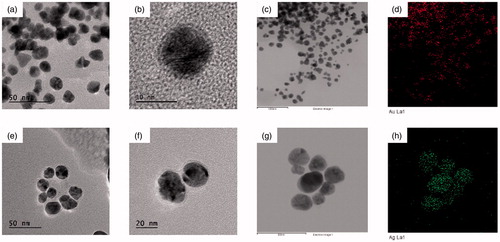
Figure 3. SAED of (a) FA-AuNps and (d) FA-AgNps. X-ray diffraction spectrum of (b) FA-AuNps and (e) FA-AgNps. (c) EDX spectrum FA-AuNps and (f) FA-AgNps. Particle size distribution profile of (g) FA-AuNps and (h) FA-AgNps with respect to intensity.
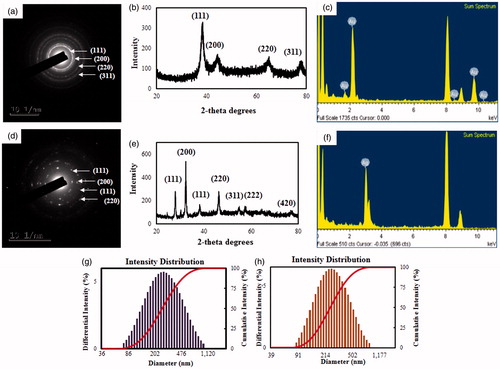
Figure 4. FT-IR spectra of biosynthesized nanoparticles and plant extract.
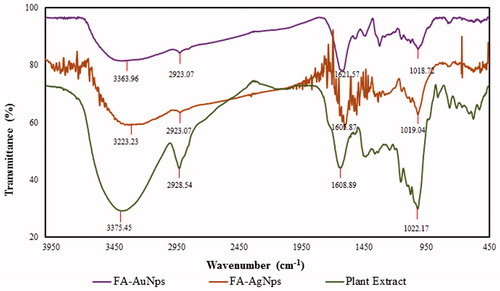
Figure 5. Dose-dependent in vitro DPPH radical scavenging activity of (a) FA-AuNps and FA-AgNps and (b) IC50 curve). Catalytic activity of (c) biosynthesized nanoparticles and plant extract.
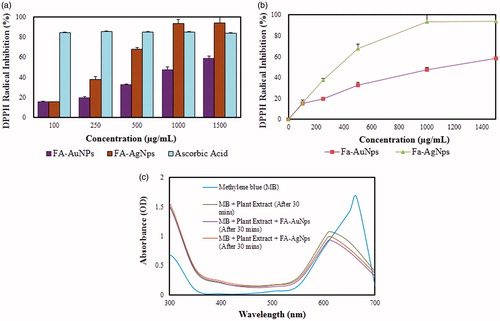
Figure 6. Antimicrobial activity of FA-AgNps against (a) Staphylococcus aureus and (b) Escherichia coli.
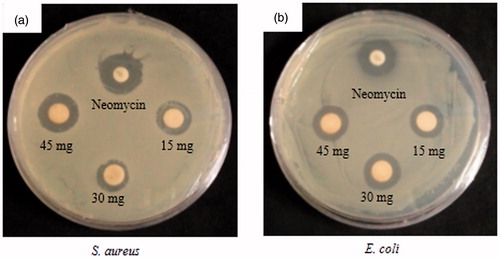
Table 1. Diameter of zone of inhibition (mm) of samples (30 μL) containing purified FA-AgNps.
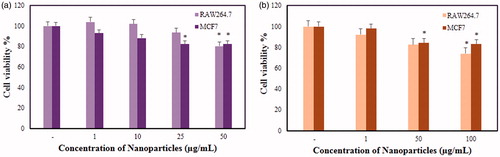
Figure 7. In vitro cytotoxicity assay of (a, b) FA-AuNps and (c, d) FA-AgNps in murine macrophage (RAW264.7) and human breast cancer cell lines (MCF7).