Figures & data
Figure 1. Chemical structure of (a) nefopam hydrochloride, (b) poly-3-hydroxybutyrate, and (c) poly-ɛ-caprolactone.
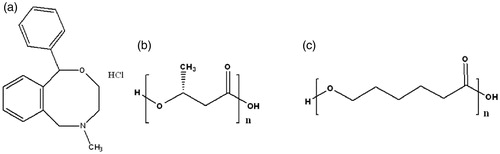
Figure 2. Formulation strategy of NPH-MS.
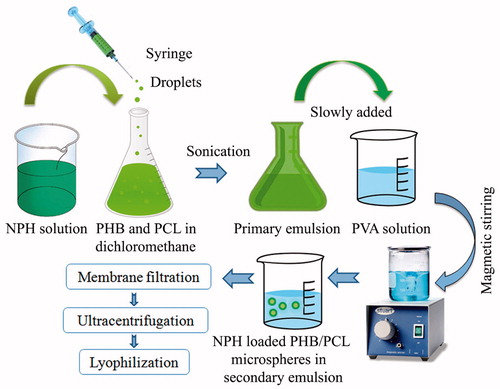
Figure 3. FTIR spectra of (a) NPH, (b) PCL, (c) PHB, (d) physical mixture, and (e) NPH-MS.
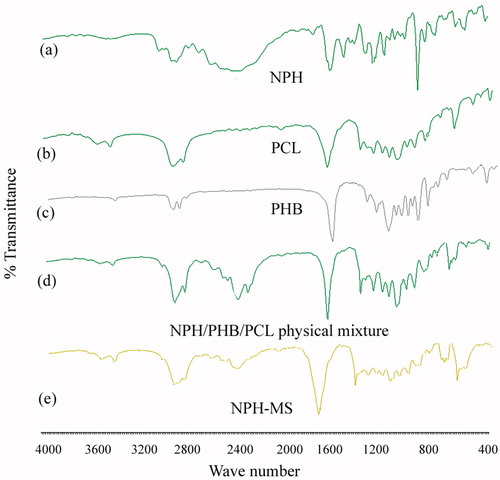
Figure 4. X-ray diffraction patterns of (a) NPH, (b) PCL, (c) PHB, (d) physical mixture, and (e) NPH-MS.
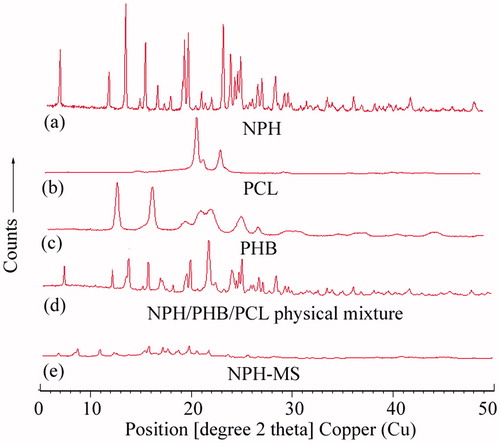
Figure 5. Scanning electron microscopic image of NPH-MS.
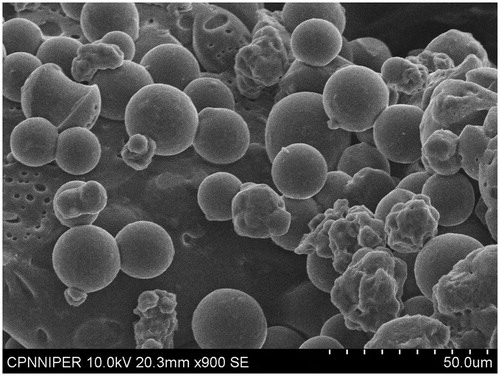
Figure 6. In-vitro drug release profile of NPH-MS in comparison to NPH and physical mixture in PBS.
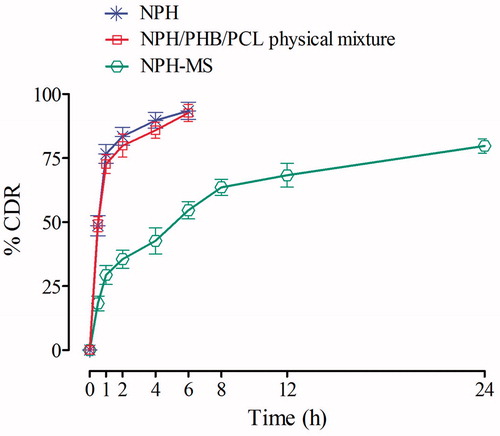
Figure 7. Percentage haemolysis of red blood cells by NPH, blank microspheres and NPH-MS.
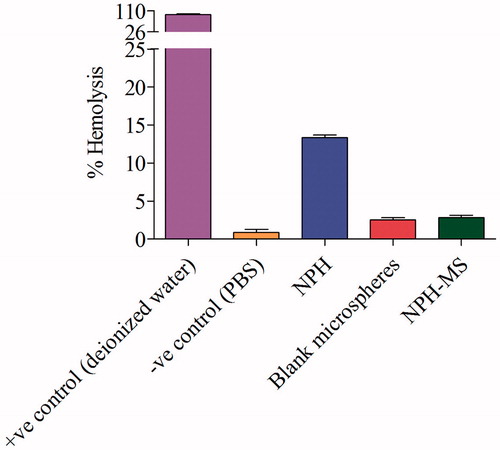
Figure 8. Tail withdrawal latency time from various doses of NPH-MS administered via peroral route (n = 5 rats per group). *p < .05, ***p < .001 compared with NPH treated rats.
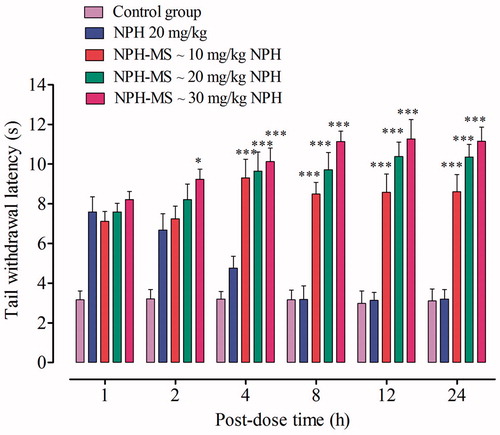
Figure 9. Anti-nociceptive effects of NPH-MS (p.o) in tail flick test (a) time-related effects, and (b) dose-related effects. **p < .01, ***p < .001 compared with NPH treated rats.
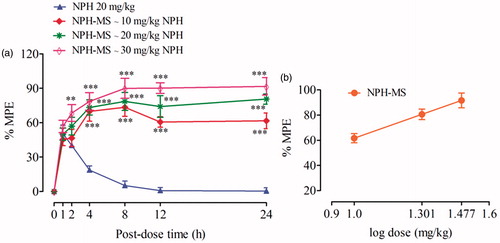
Figure 10. Effect of NPH-MS (p.o) on the paw withdrawal threshold as tested by von Frey test (n = 5 rats per group). *p < .05, ***p < .001 compared with NPH treated rats, ‡p < .001 compared with the control group.
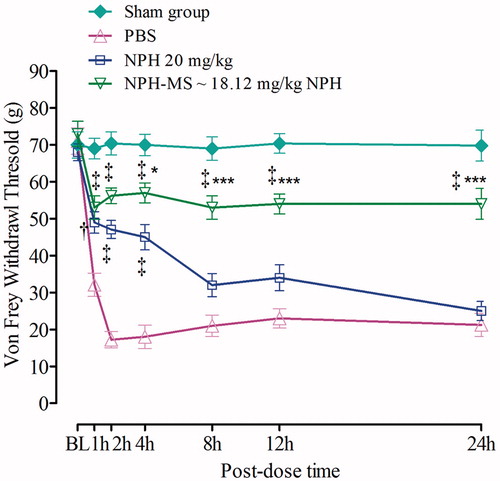
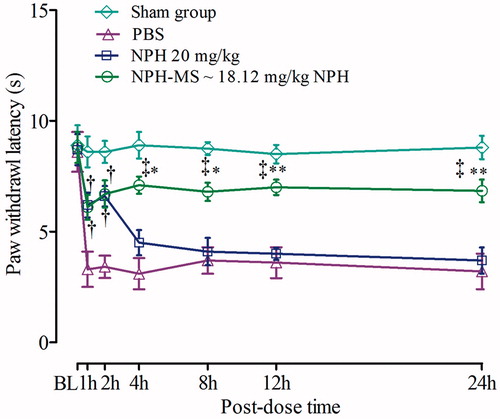
Figure 11. Effect of NPH-MS (p.o) on the PWL as tested by plantar test (n = 5 rats per group). *p < .05, **p < .01 compared with NPH treated rats, †p < .01, ‡p < .001 compared with the control group.