Figures & data
Table 1. The primers sequences of target genes.
Figure 1. Reduction of silver nitrate through the addition of plant extract that is associated with colour changes.
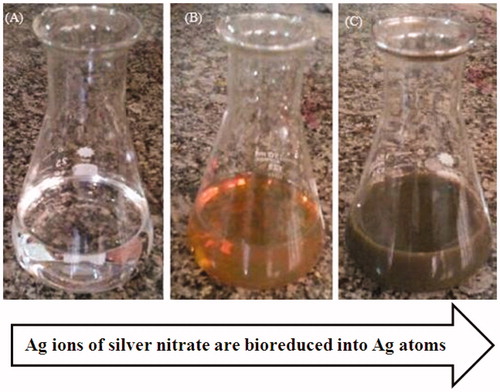
Figure 2. UV–visible spectrum of biologically synthesized silver nanoparticles during the reaction.
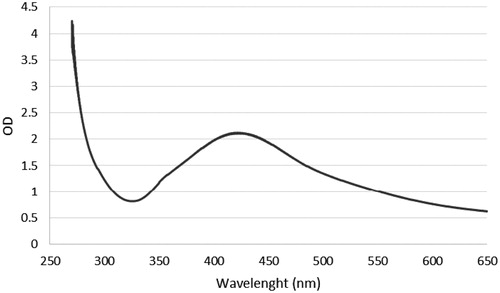
Figure 3. XRD pattern of AgNPs synthesized in optimal conditions. Pattern of XRD peaks related to face-centred cubic (fcc) (111), (200), (220), (311) and (222) in sample silver spectrum. 2θ angles related to silver pattern are observed in 38.04, 44.5, 64, 77.7 and 81.7.
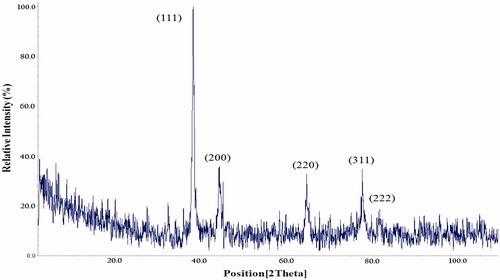
Figure 4. SEM analysis of AgNPs synthesized using green method in optimal conditions.
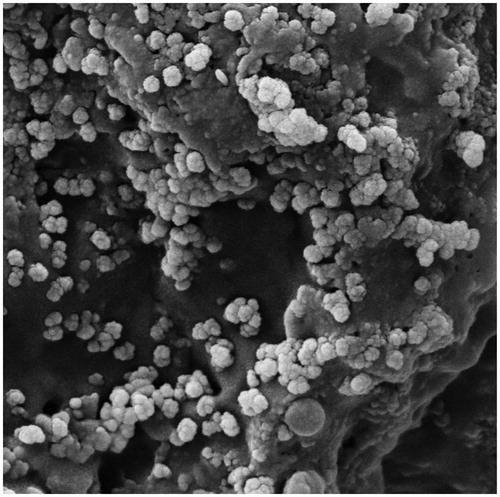
Figure 5. TEM images of synthesized AgNPs using green synthesis method.
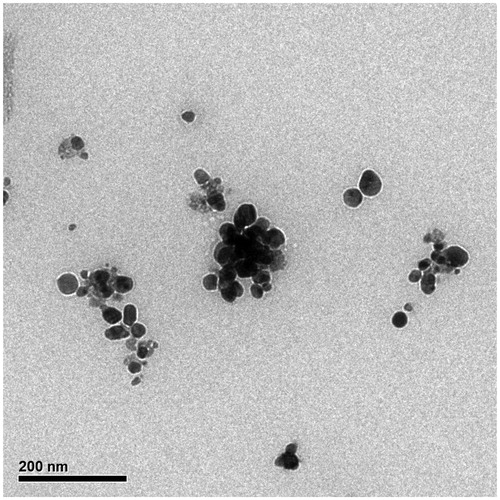
Figure 6. The size distribution of particles in TEM images. The diagram shows that the average size of AgNPs is 38.89 nm.
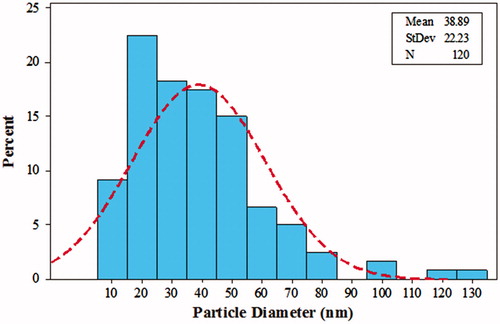
Figure 7. FTIR of AgNPs. The results of FTIR analysis of AgNPs showed different stretches of bonds at different peaks, 1014, 1048, and 1595, 2368 and 3344 cm−1.
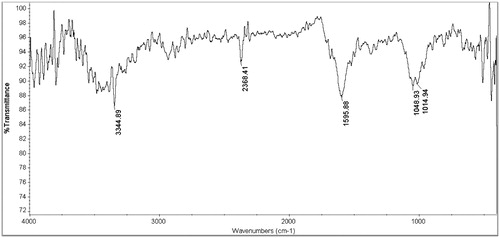
Table 2. Minimum inhibitory concentration (MIC) against the four bacteria.
Figure 8. Survival percentage of HT29 cells against various concentrations of AgNPs within 24 hours. Results have been reported as survival rate compared with control samples. (n = 3: p < .001***, p < .01**, p < .05*).
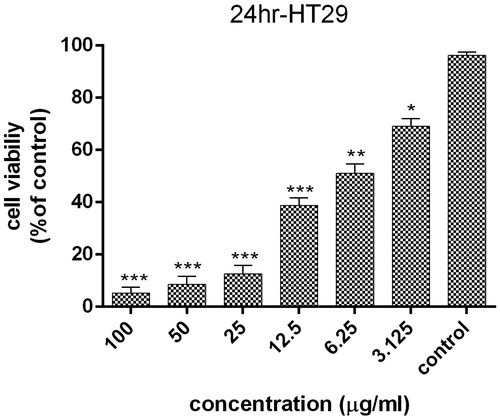
Figure 9. Survival percentage of normal L929 cells against various concentrations of AgNPs within 24 h; results have been reported as survival rate compared with control samples. (n = 3, p < .001***, p < .01**, p < .05*).
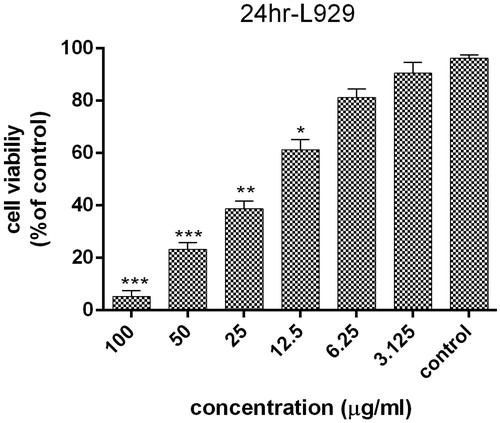
Figure 10. The expression of Bax and Bcl2 genes level comparing to reference gene (GAPDH). The expression ratio of Bcl2 and Bax genes in HT29 cancer cell line treated with AgNPs was reduced by 0.43 ± 0.53% and increased by 10.33 ± 0.76% within 24 h, respectively. (p < .05)*, p < .01**, p < .001***, n = 3).
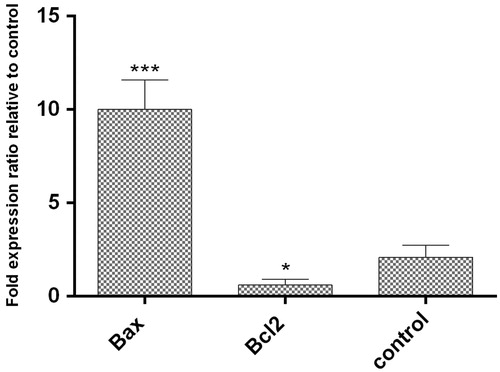
Figure 11. Flow cytometry analysis of HT29 cell line. B) Untreated control samples D) AgNPs treated samples. A and C represent the entire content of the cells. The bottom left square: live cells, top left square: early apoptosis, bottom right square: necrosis, upper right square: delayed apoptosis. In the samples treated with AgNPs, the cells enter to early apoptosis (15.64%) and delayed apoptosis (21.32%).
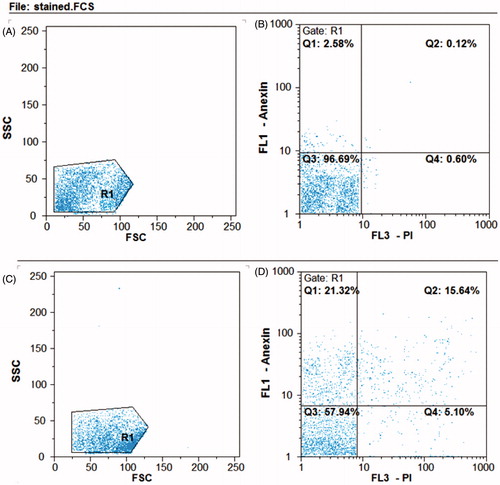
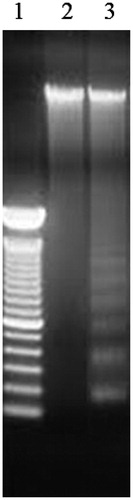
Figure 12. The results of DNA fragmentation test. Lane 1: DNA samples that treated with AgNPs. Lane 2: Un-treated cells, Lane 3: DNA marker.