
Figures & data
Table 1. Effect of PEGylation and DOTAP addition on liposomal DOX characteristics.
Table 2. Effect of drug encapsulation.
Figure 1. FTIR spectra of optimal formula (F6) (a): after drug loading, (b): before drug loading, and (c): DOX.
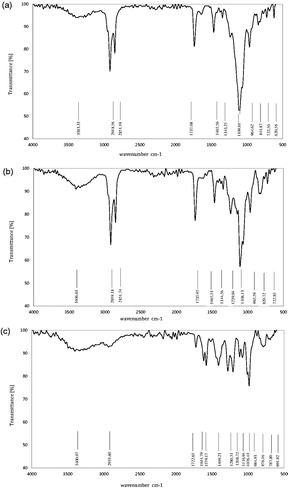
Figure 2. (a) TEM (bar = 100 nm) and FESEM (b) micrographs of optimum formula (F6 + DOX).
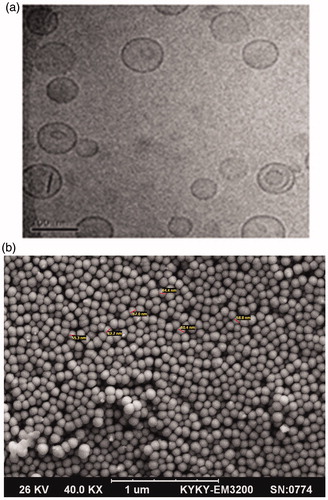
Figure 3. Physical stability study of optimal formula (F6 + DOX) during 6 months. (a) Encapsulation efficiency, (b) Vesicle size, (c) PDI and (d) ζ- Potential.
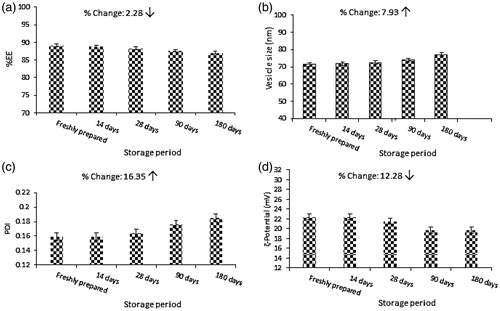
Figure 4. Cell viability on human primary osteoblasts and MG-63 cell line of liposomal formulations with various concentrations, determined after 72 h using Alamar Blue colorometric assay.
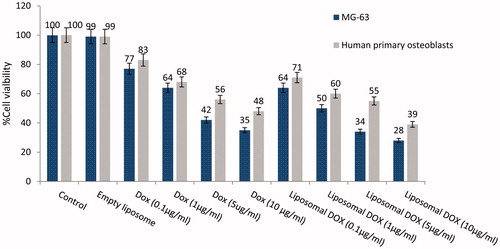
Figure 5. The capacity of gene incubation evaluation by zeta potential measurement during siRNA incubation. (a) Before siRNA incubation. (b) After siRNA incubation.
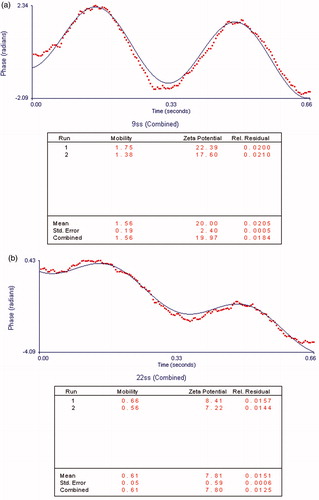
Figure 6. In vitro kinetic release of drug for F6 formula in various pH (a) and temperatures (b).
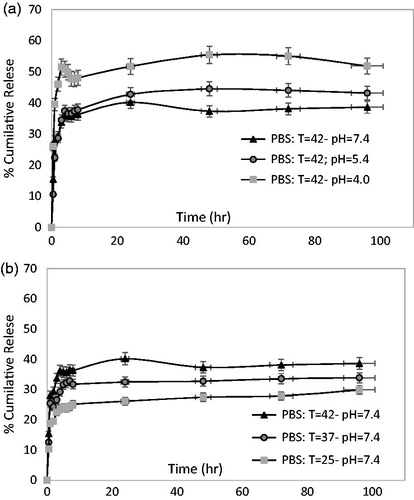
Table 3. Proposed model coefficients (expression 2).
Table 4. Model constants and validation of model coefficient.
Table 5. Slope and R2 for predicted release vs. experimental release.