
Figures & data
Figure 1. Schematic illustration of the preparation of PVA-AMWCNT composite microspheres.
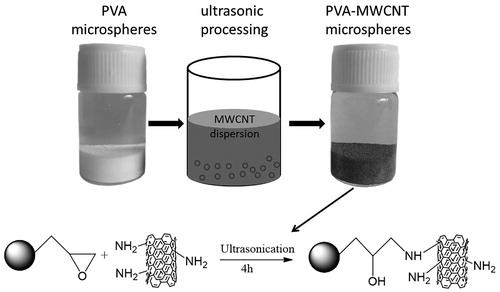
Table 1. Physical parameters of PVA and PVA-AMWCNT microspheres.
Figure 2. Characterization on the surface morphology. (a,b: PVA microspheres; c,d: PVA-PMB microspheres; and e,f: PVA-AMWCNT composite microspheres. AMWCNT is indicated by the white arrows.)
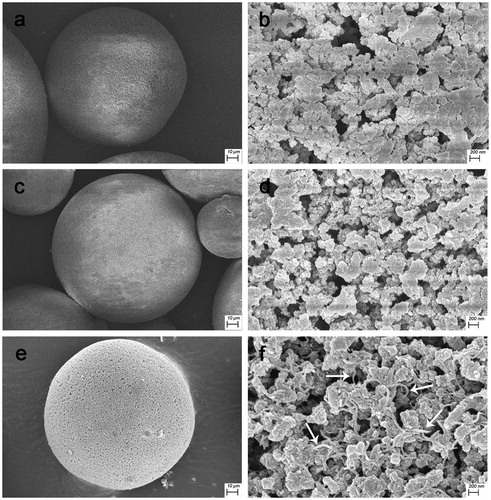
Figure 3. Bright field and fluorescent photographs of PVA (a–c) and FITC-AMWCNT reinforced PVA (d–f). For each panel, images from left to right show bright field, fluorescent photographs, and overlays of two images, respectively.
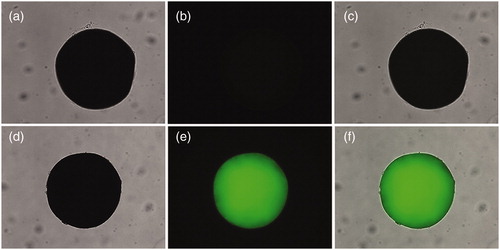
Figure 4. Raman spectrums of PVA and PVA/AMWCNT microspheres.
(D band: 1350 cm, G band: 1590 cm)
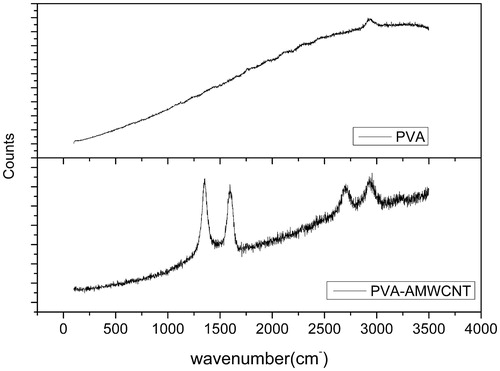
Figure 5. Endotoxin adsorption capacity and BSA adsorption percentage of microspheres.
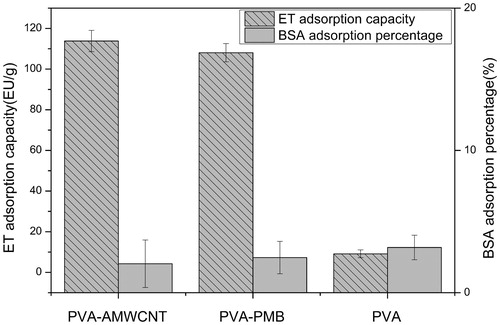
Figure 6. Dynamic curves of endotoxin adsorption by adsorbents.
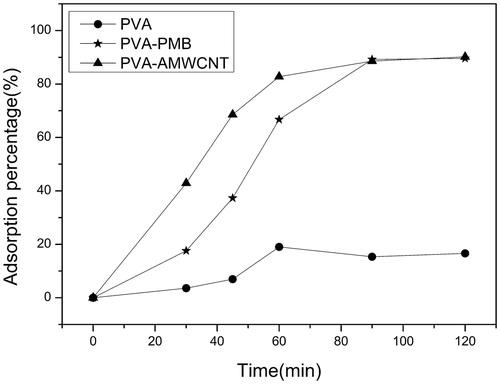
Table 2. Haemolysis degree and blood routine of PVA and PVA/AMWCNT composite microspheres (mean ± SD, n = 3).