Figures & data
Figure 1. Relative expression levels of miR-133 in glioma. *p < .05.
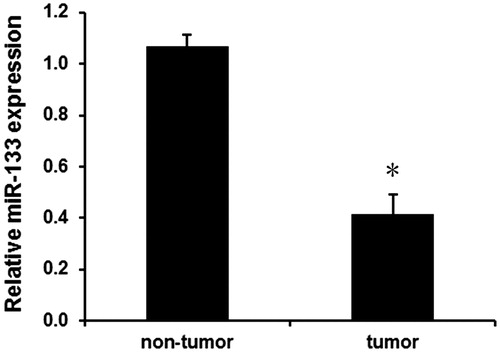
Table 1. The relationship between miR-133 expression and clinicopathological features in glioma patients.
Figure 2. Effects of miR-133 on cell proliferation and invasion of glioma. (A) The effects of miR-133 mimic on miR-133 expression in U87 cells. The effects of miR-133 mimic on cell proliferation (B) and invasion (C and D) in U87 cells. *p < .05.
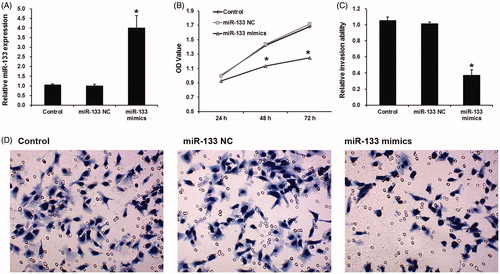
Figure 3. FOXC1 is a direct target of miR-133 in glioma. (A) miRNA target soft predicted the target site of miR-133 on the 3’UTR of FOXC1 mRNA. (B) dual-luciferase reporter assay revealed the target role of miR-133 on FOXC1.
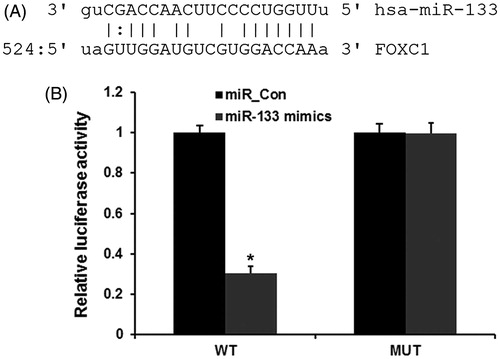
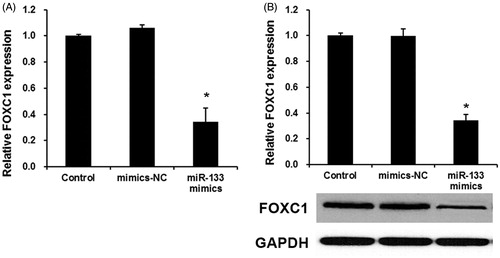
Figure 4. FOXC1 was overexpressed in glioma tissue and directly regulated by miR-133. (A) qRT-PCR assay the FOXC1 expression in glioma tissues. *p < .01 versus normal tissues. (B) The effects of miR-133 mimics on the expression levels of FOXC1 mRNA (B) and protein (C). *p < .01 versus control group.