Figures & data
Table 1. Size, PDI and zeta potential of various NLCs.
Figure 1. The cellular uptake of various Cou6-loaded NLCs. The data are presented as the mean ± SD (n = 3). *p < .05; **p < .01; NS: not significant.
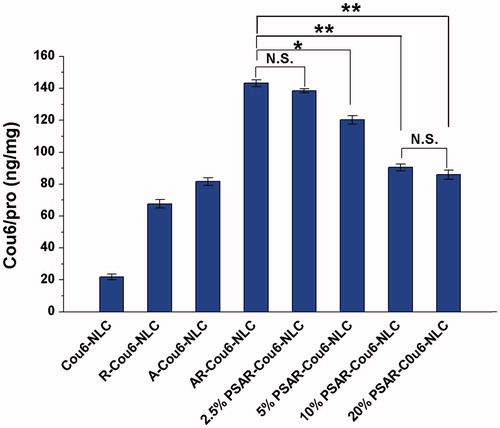
Figure 2. The cellular uptake of PSAR-Cou6-NLCs modified with different PEG density in the presence of different l-Cys concentration. The data are presented as the mean ± SD (n = 3).
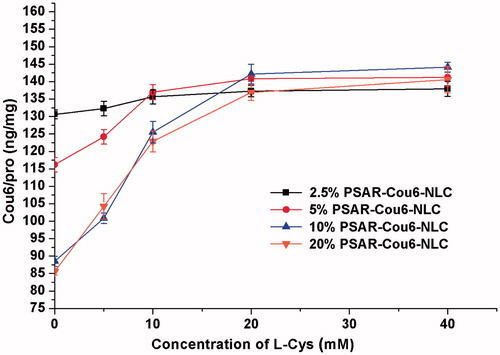
Figure 3. The cellular uptake of Cou6-loaded AR-NLC, 10% PSAR-NLC and 10% PAR-NLC before and after the treatment of l-Cys. The data are presented as the mean ± SD (n = 3). **p < .01; NS: not significant.
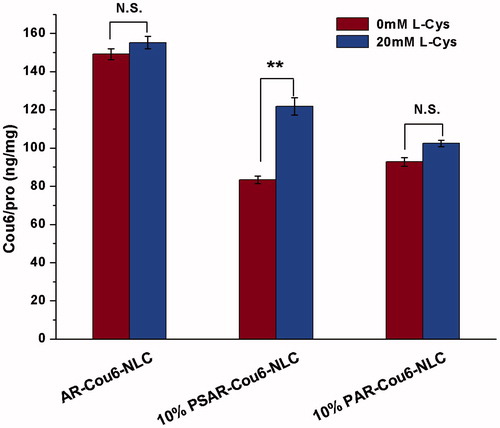
Figure 4. The CLSM images treated with Cou6-loaded 2.5% PSAR-NLC (a), 5% PSAR-NLC (b), 10% PSAR-NLC (c) and 10% PAR-NLC (d) in the presence of different l-Cys concentrations: (A) 0 mM, (B) 5 mM, (C) 10 mM and (D) 20 mM.
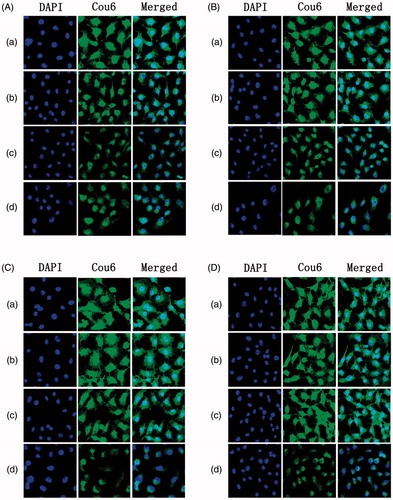
Figure 5. In vitro cytotoxicity of PTX-loaded NLC, AR-NLC and 10% PSAR-NLC. The data are presented as the mean ± SD (n = 6).
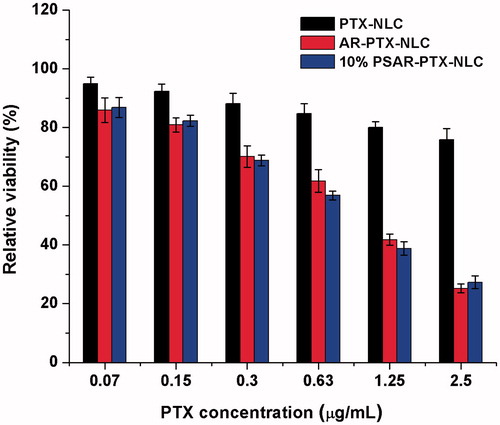
Figure 6. In vitro cytotoxicity of various blank NLCs. The data are presented as the mean ± SD (n = 6).
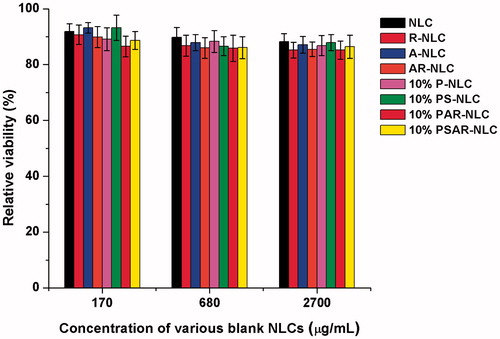
Figure 7. In vivo biodistribution of NLCs at 1, 4, 8, 12, 24 and 48 h after intravenous tail injection in tumour-bearing mice. (a) DiR-NLC, (b) AR-DiR-NLC, (c) 10% PAR-DiR-NLC and (d) 10% PSAR-DiR-NLC.
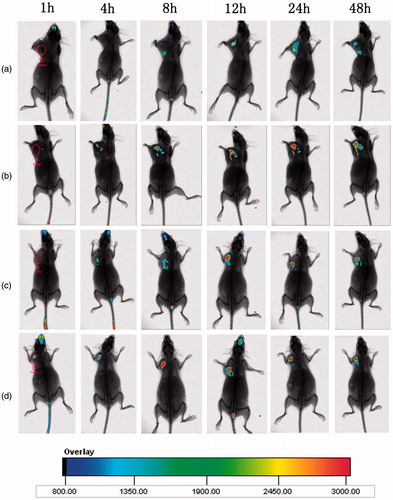
Figure 8. Fluorescence imaging of major organs and tumour taken from tumour-bearing mice after 48 h post-injection of DiR-NLC (a), AR-DiR-NLC (b), 10% PAR-DiR-NLC (c) and 10% PSAR-DiR-NLC (d), respectively.
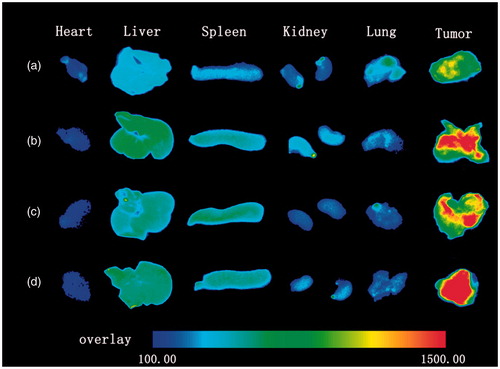
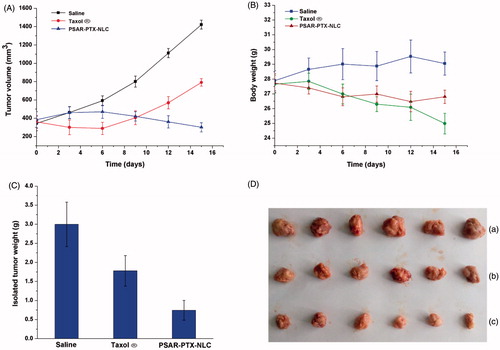
Figure 9. The in vivo anti-tumour study of PTX-loaded 10% PSAR-NLC in tumour-bearing mice. (A) Changes of tumour volume, (B) Body weight changes for the tumour-bearing mice, (C) The weights of the removed tumours were measured after the completion of the in vivo assays. The data are presented as the mean ± SD (n = 6). (D) Photograph of the solid tumours removed from different treatment groups at the study termination. (a) Saline, (b) Taxol® and (c) 10% PSAR-PTX-NLC.