Figures & data
Figure 1. Characteristics of KPAE. (A) Chemical structures of KDA and KPAE. (B) 1H NMR spectrum of KPAE in CDCl3. (C) GPC spectrum of KPAE in acid environment.
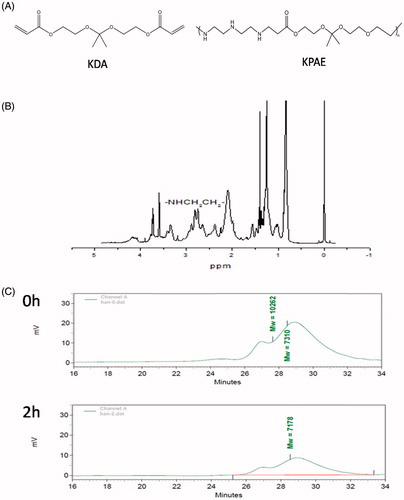
Figure 2. Characteristic of EPI/siRNA-MEND. (A) TEM image. (B) Picture of agarose gel electrophoresis, channel 1-naked siRNA, Channel 2-EPI/siRNA-MEND. (C) Size distribution and Zeta potential distribution.
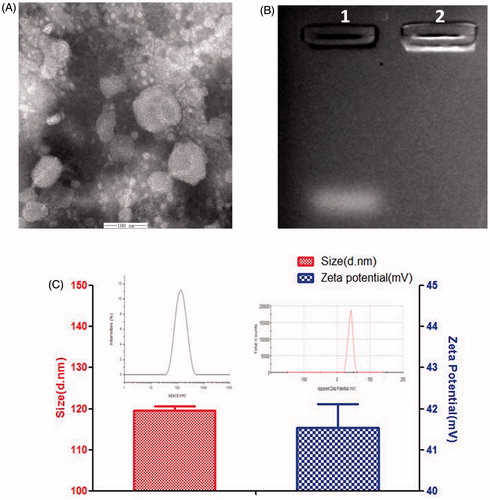
Figure 3. HPLC chromatogram of MEND (A), EPI (B) and EPI-MEND (C).
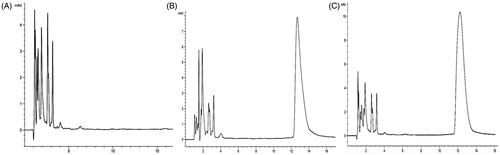
Figure 4. In vitro cytotoxicity analysis.
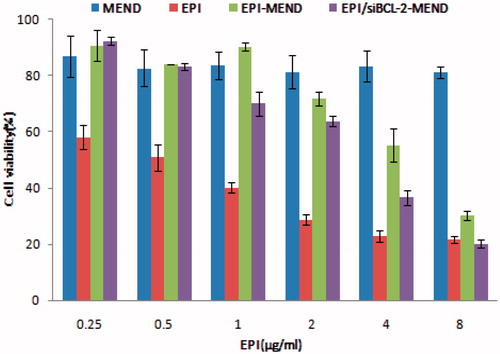
Figure 5. Picture of cellular uptake experiment result.
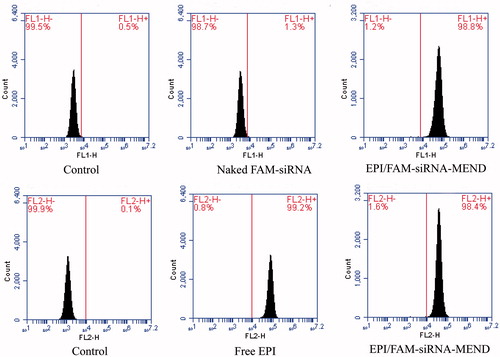
Figure 6. Picture of endocytosis of MEND. (A) Location of FAM-siRNA-MEND (green). (B) Location of lysosome (blue). (C) Over lay of (A) and (B). (D) Location of EPI-MEND (red). (E) Location of cell nucleus (blue). (F) Over lay of (D) and (E).
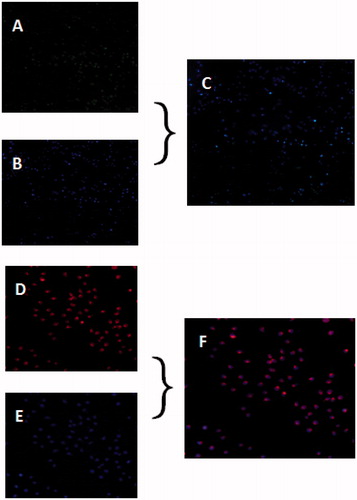
Figure 7. Expression of P-gp in HepG2 cells. Top panel: images of P-gp expression with EPI. Bottom panel: representative western blot images of P-gp expression with different MEND.
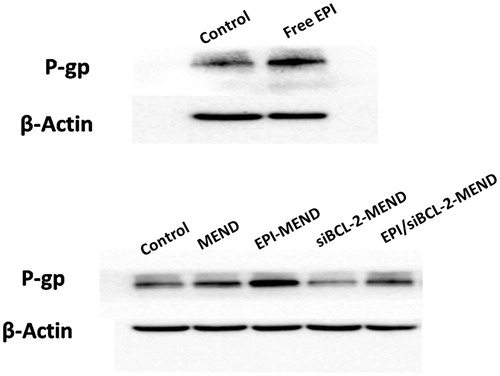
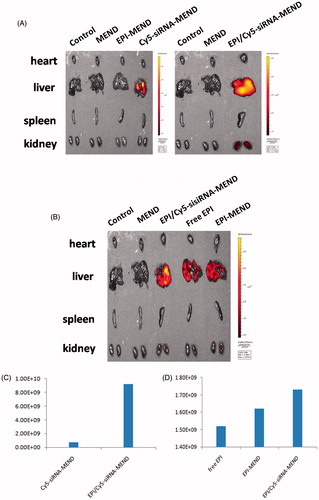
Figure 8. Picture of in vivo distribution of MEND. (A) Distribution of Cy5-siRNA-MEND and EPI/Cy5-siRNA-MEND (excitation wavelength was 650 nm). (B) Distribution of EPI/Cy5-siRNA-MEND, free EPI and EPI-MEND (excitation wavelength was 480 nm). (C) Comparison of Cy5-siRNA fluorescence in the liver. (D) Comparison of EPI fluorescence in the liver.