Figures & data
Figure 1. Moisture retentions of GBE and Gb-AuNPs solution (10–100 μg/mL). Results are expressed as mean ± SD of three separate experiments. For moisture retention assay, Glycerin solution (10 and 50 ppm) was used as reference standard.
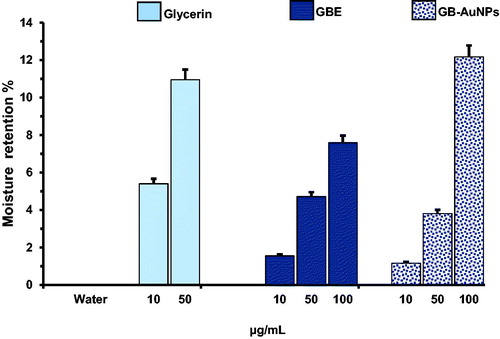
Figure 2. Cell viability of HDF cells (A), B16BL6 cells (B) and optical microscopy images of HDF cells (C) and B16 cells (D) (40 × Magnification). After treatment with GBE, Gb-AuNPs and HAuCl4·3H2O. Cells (1 × 10⁵ cells/well) were incubated with various concentrations (1–200 μg/mL) of Gb-AuNPs for 24 h. Cell viability was determined by 3-(4,5-dimethyl-thiazol-2yl)-2,5-diphenyl tetrazolium bromide (MTT) assay. Note that samples did not show toxicity effect up to 200 μg/mL for Gb-AuNPs. Results are expressed as a percentage of sample-treated control and presented as mean ± SD of three separate experiments.
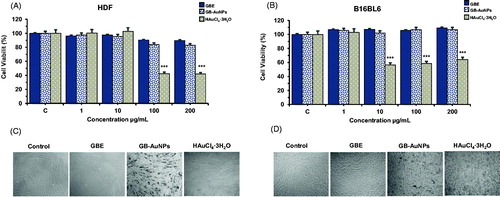
Figure 3. Co-treatment, radical-scavenging effect of Gb-AuNPs on HDF cells against H2O2-induced cell damage. HDF cells were co-treated with various concentrations of Gb-AuNPs and 10 μM of H2O2, incubated for 24 h at 37 °C. Cell viability was determined by MTT assay. Results are expressed as mean ± SD of three separate experiments. Ascorbic acid (100 μg/mL) was used as reference standard.
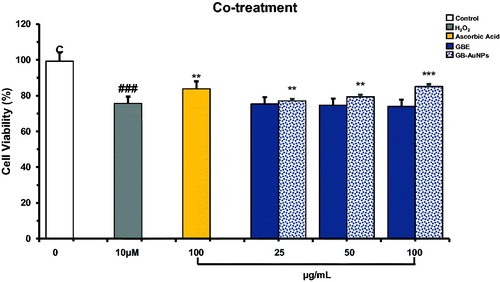
Figure 4. Pre-treatment, radical-scavenging effect of Gb-AuNPs on HDF cells against H2O2-induced cell damage (A) and Optical microscopy images of HDF cells (B) (40 × magnification). HDF cells were pre-treated for 24 h with various concentrations of Gb-AuNPs and then exposed to 10 μM of H2O2 for 1 h at 37 °C. Cell viability was determined by MTT assay. Results are expressed as mean ± SD of three separate experiments. Ascorbic acid (100 μg/mL) was used as a reference standard.
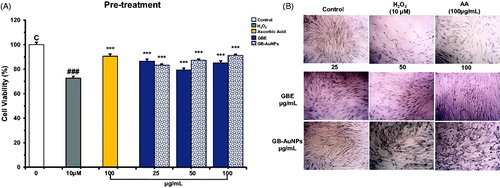
Figure 5. Post-treatment, radical-scavenging effect of Gb-AuNPs on HDF cells against H2O2-induced cell damage (A). and Optical microscopy images of HDF cells (B) (40 × magnification). HDF cells were exposed to 10 μM of H2O2 for 1 h at 37 °C and then treated with various concentrations of Gb-AuNPs for 24 h. Cell viability was determined by MTT assay. Results are expressed as mean ± SD of three separate experiments. Ascorbic acid (100 μg/mL) was used as a reference standard.
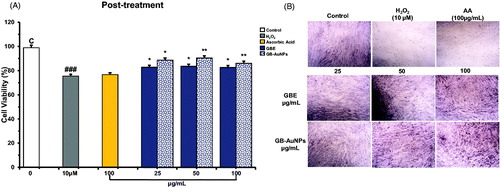
Figure 6. Comparative study of the inhibition effect of GBE and Gb-AuNPs on melanin content in B16BL6 cells. Cells were incubated with different concentrations (1–100 μg/mL) of GBE, Gb-AuNPs or Arbutin (100 μg/mL) in the presence of 100 nM of α-MSH for 24 h. Results are expressed as a percentage of α-MSH-treated control and presented as mean ± SD of three separate experiments. *p < .05 **p < .01, ***p < .001 versus α-MSH treated control by Student’s t-test.
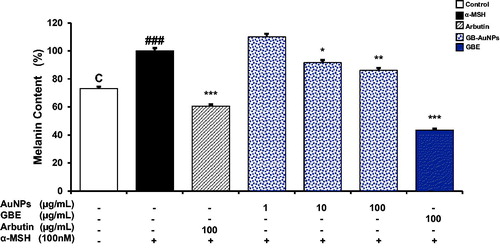
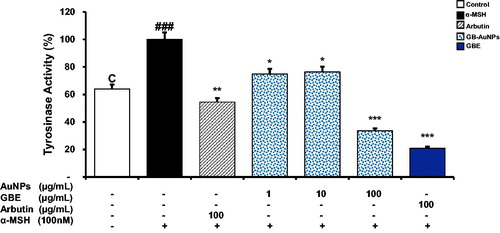
Figure 7. Comparative study of the inhibitory effect of melanogenesis of GBE and Gb-AuNPs through inhibition of tyrosinase activity. B16BL6 cells were incubated with various concentrations of (1–100 μg/mL) GBE, Gb-AuNPs or Arbutin (100 μg/mL) in the presence of 100 nM of α-MSH for 24 h. Tyrosinase activity in cellular lysates was determined as described in “Material and methods” section. Results are expressed as a percentage of α-MSH-treated control and presented as mean ± SD of three separate experiments. *p < .05 **p < .01, ***p < .001 versus α-MSH-treated control by Student’s t-test.